- About Us
- Climate & Environment
- Our Culture
- Governance
- Stories

Chubb Group Executives

Chubb has operations in 54 countries and territories and can help clients manage their risks anywhere in the world.

The company took its present form in 2016 when ACE Limited acquired the Chubb Corporation, creating a world leader in insurance.

The National Geographic Society and the Chubb Charitable Foundation are partnering together to drive transformational change for vital ecosystems at the intersection of land and water.

Chubb Climate+ draws on our extensive technical capabilities in underwriting and risk engineering, bringing together Chubb units engaged in Renewables, Alternative Fuels, Climate Tech, and Risk Engineering services.

At Chubb, we recognize our responsibility to provide solutions that help clients manage environmental risks, to reduce our own environmental impact and to make meaningful contributions to environmental causes.

Chubb’s culture is defined by who we are, the behaviors we expect of each other, and what we reward and recognize.

Guided by steady leadership and a commitment to the highest levels of personal and professional integrity.


Discover our latest news, insights, stories and profiles
Chubb Limited 2024 Letter to Shareholders

Evan G. Greenberg
Chairman and Chief Executive Officer
Chubb Group
In This Letter
To My Fellow Shareholders
Chubb had a standout performance last year – the best in our company’s history. We capitalized on favorable insurance market and economic conditions while managing in a time of significant opportunity, heightened uncertainty and risk. We produced a double-digit increase in pre-tax operating earnings, supported by record underwriting results, an industry-leading combined ratio and record investment income. We grew Global P&C premiums nearly 10% and life insurance premiums 18.5% in constant dollars. We are a compounder of wealth in the business of taking and managing risk. In 2024, we added to our record of strong value creation for shareholders.
Risk is a growth industry, and that means opportunity. We create value through three sources of income, each with vast opportunity to expand and grow over time: 1) We are world-class property and casualty (P&C) underwriters of businesses and individuals globally; 2) We are accomplished investment managers with a proven track record of generating excellent risk-adjusted returns on a growing portfolio of assets; and 3) We are growing a meaningful Asia life business. Each of these three contributed record results in 2024. P&C underwriting income was $5.9 billion, up 7.1%, and up 58% over the past three years. Adjusted net investment income grew 19.3% to $6.4 billion, up 59% since 2022. And life insurance income was $1.1 billion, more than double the amount from three years ago.
Chubb’s operating income of $9.2 billion grew 11.2% on a pre-tax basis. It shrank 1.5% after tax, distorted by a one-time Bermuda tax benefit we received in 2023. Looking through that, which is the way I view our performance, operating income was up 11.5% in 2024. Over the past three years, operating income has grown 65% and is nearly double the amount from pre-Covid 2019.
We’ve had a hell of a run, over the short term and long term, and, as far as I’m concerned, we’re just beginning. When I became chief executive of ACE 20 years ago, we produced about $1 billion of operating income through a limited number of business lines, had a market value of about $11.5 billion and wrote $16 billion in gross premiums. By the end of 2015, we had risen from #23 in the world to #11, and had become a large, diversified global insurer, with triple the operating earnings and market value of $38 billion. Two-thirds of that growth had been achieved organically and the rest through acquisition. We had become large enough and diversified enough to acquire Chubb that year and create what would become a global powerhouse.
The combined company performed very well, though we purposely constrained growth due to overly competitive commercial insurance market conditions. Risk pricing wasn’t sufficient to justify more rapid growth. However, we continued to invest in our capabilities – physical presence, product, distribution and technology. We shrank some businesses and grew others where conditions were favorable. Commercial P&C market conditions began to change in 2019 as competitors withdrew capacity due to underwriting losses. Pricing and terms began to approach a reasonable level. We had the capital, appetite and global presence to capitalize, and we did. Since ’15, our earnings and market cap tripled again to $9.2 billion and $114 billion at the time of this writing, growing total return to shareholders at an annual rate of 12% over the entire 20-year period. And, by the way, our 2024 operating cash flow was a record $15.9 billion, which speaks to our future earning power.
Today, Chubb is among the world’s largest insurance companies. Gross premiums, our company’s top-line premium revenue figure, were $62.0 billion last year. I only look at gross premiums when considering our market presence. On a net basis, my main focus and the measure that reflects the premiums and risk we retain on our balance sheet, we wrote $51.5 billion. We grew net premiums 8.7% – or 10.4% excluding agriculture, a business that is idiosyncratic – with growth of 8.7% in commercial lines and 13.3% in consumer lines. Total company net premiums have grown more than 35% over the past three years and about 60% over five years.
In reporting the performance of an underwriting and risk-taking company, the most important line on the P&C insurance scorecard is the published combined ratio, which measures underwriting profitability. Ours was 86.6% in 2024 and has averaged 86.9% over the past three years, a gold standard among insurers globally. No matter what time period you pick – three, 10 or 20 years – we have outperformed our peers and the industry generally by eight to nine percentage points. On a current accident year basis excluding catastrophe (CAT) losses, a secondary measure that looks through catastrophe-related volatility to current period results, our combined ratio last year was 83.1%. Our advantage is not simply in our underwriting. It’s also our operating efficiency. We run an expense ratio of 26.2%, and this is a meaningful and enduring advantage.
The business of taking risk is a balance sheet business. The substantial strength of our capital base supports our ability to grow our businesses and take more risk, and, in turn, grow underwriting profit, our invested asset and investment income. Next to capital, loss reserves are the most important part of our balance sheet – they reflect our obligations to our policyholders – and we consistently strive to manage them conservatively. Our reserves stood at $84 billion at year-end and are as strong as I can remember.
Our opportunity for growth and value creation is constrained only by our own ambition, discipline and creativity. While we are one of the largest insurers in the world, the $62 billion of premiums that we wrote in 2024 is a rounding error in the $5.5 trillion-and-growing global insurance marketplace. We are relentlessly investing in our capabilities to increase our optionality and capitalize on commercial and consumer growth opportunities globally – in particular, in North America, Asia, Europe and Latin America. We have been investing to lead in a digital age, and we are rapidly expanding our skills, data, analytics and artificial intelligence capabilities to improve on all we do, from marketing to underwriting to claims. Our ability to groom and develop talent and leadership is a basic part of our management responsibilities and a feature of our culture. This was evident in the important management promotions we made last year, which I’ll discuss shortly.
In a world full of opportunity and risk to be assumed and managed, Chubb is well positioned for future growth in revenue, income and, in turn, wealth creation for shareholders. We’ve built a global business with the scale, presence, capability and talent to create and capitalize on opportunity where it appears. I am more confident and energized than ever by our prospects.
What Makes Us Distinctive and Compelling
This letter is an opportunity for me to come to account to shareholders about the company we own and to express my views about important issues that matter for our business. It’s where I explain who we are and what makes us distinctive and compelling, and share my thoughts about our results, strategies, leadership qualities, culture and the environment in which we operate.
I will begin with the basics. Chubb helps businesses, people and society manage risk by underwriting a broad, globally balanced portfolio of insurance products and risk-related services that help to prevent or mitigate misfortune. We are well diversified, which provides an important element of stability in the business of risk, while multiplying areas of opportunity for growth. Two-thirds of our insurance-related revenue and underwriting earnings come from commercial customers. We serve the smallest to largest companies globally. A little more than one-third of our business is insuring people – from the homes, autos, art and jewelry of high-net-worth individuals in the U.S., to the lives, health, electronics and pets of middle-income and emerging-middle-income households around the world. In short, we help people and businesses protect themselves and manage the risks they face.
Chubb is a true multinational, well balanced and integrated, with a portfolio of high-performing businesses operating in 54 countries and territories. Approximately 43,000 employees operate out of more than 1,100 offices in North America, Europe, Asia, Latin America and other parts of the world. About 60% of our premiums are written in North America, with circa 40% spread across Asia, the U.K. and Europe, and Latin America.
Our Asia operation, with more than 800 offices in 15 countries and territories, is the second largest region in the company after North America. It now produces about 20% of total company premiums. Korea is the second largest country for Chubb after the U.S. More than 75% of our business in Asia (and half of our Asia non-life premium) is consumer-focused – accident and health (A&H), life and personal lines – and these businesses as well as our commercial P&C business have a lot of opportunity for growth. Asia is vast, a collection of many distinct markets both large and small. It takes years of patient building to create the presence necessary to capitalize on the growth themes we observe. In my judgment, Asia and North America are the two regions with the greatest long-term wealth creation opportunity for Chubb – and for American business for that matter. We are well positioned and getting deeper in both.
Our scale and diversification of businesses position us to grow where we see opportunity. Diversification also applies to our distribution capabilities. It’s one thing to have capital and expertise to underwrite; it’s another to have the local presence and distribution depth and breadth to reach customers in the way they prefer to buy. From the smallest business to the largest, from lower-income consumers to high-net-worth clients, from developing markets like Vietnam to advanced economies such as the United States, Australia and the U.K., and the other 50 countries and territories where we do business in between – we are marketers with a strong capability in distribution. Our distribution network spans 50,000 independent brokers and agents, hundreds of thousands of exclusive life and health agents, and hundreds of direct-to-consumer partnerships that give us access to hundreds of millions of existing and potential customers through fully digital, phone and face-to-face sales. By example, we are the #1 or #2 insurer with 15 of the top 20 brokers in the U.S., yet the largest direct marketer of insurance in Asia.
Whether a business or a person, your reputation is your most precious asset: easy to say, hard to earn and easy to lose. Chubb’s is distinctive, and we don’t take it for granted. We have a reputation for quality of service and dependability. Our customers have confidence in us. In many instances, they are willing to pay more for Chubb, and we are committed to living up to that reputation. When disaster or misfortune strikes, it’s our job to provide an extraordinary level of support – a point I will return to shortly.
Every successful company has a clear understanding of its purpose, and at our core we are an underwriting company, with a culture built and managed by underwriters. In a risk business, underwriters have the training, knowledge and instincts to conceptualize, structure, price and assume risk. We are obsessed with the art and science of underwriting, as well as the discipline, governance and culture of our craft. Our insurance portfolio has been carefully constructed over years and is balanced by product, customer, geography and distribution channel. When conditions support our expectation for adequate risk-adjusted returns, we grow exposure aggressively. On the other hand, we sacrifice top-line growth and shrink, even ruthlessly, to preserve an underwriting profit when conditions are inadequate.
The Chubb culture is unique, and it’s personal. The true citizens of our culture are personally invested and own it. Our ethos is one of builders with a clear vision. We are hungry, ambitious, results-focused and maniacally execution-oriented. We innovate and adapt. We are a well-integrated organization with a relatively flat management structure that enables rapid decision-making and oversight. When I say well-integrated, that means horizontally and vertically. Ideas and capabilities in our company move around the world while we maintain a strong command-and-control governance process. All of this is supported by advanced management information and maturing data capabilities to ensure insight, discipline and consistency without sacrificing our entrepreneurial nature. We are transforming to lead in a digital age.
We strive to be genuine regardless of how the political winds blow and have been steadfastly committed to the notion of creating a diverse and inclusive meritocracy. That means we strive to ensure an environment that attracts the best and the brightest – without regard to gender, color, race, age, religion or other distinctions – and recognizes and rewards our people for their contribution to results. In a word, that’s accountability. We want people at Chubb to be comfortable to do their best, and we mean to carry ourselves with humility, professionalism and earnestness. We are frank though respectful of each other. We don’t sweep problems under the rug or rationalize away mistakes. We’re frank because we want to get better quickly, and we are respectful because that is the way we expect others to treat us.
The higher you go in this organization, the harder you work and the more you are held to these values. The sacrifices expected of leadership are an honor, not a burden. We develop our leaders thoughtfully over years. We made several important leadership changes last year, including at the top of our two largest business segments, North America and Overseas General, and in the Asia-Pacific and Latin America regions. In the first quarter of ’25, we made senior leadership changes in two other major businesses as well – our Europe region and our U.S. high-net-worth business. These changes were well planned and drew from a deep pool of long-tenured talent, the result of our decades-old succession and grooming process.
To give you a sense of how this process works, every year our senior leadership team, led by me, takes two days to review our business and support units’ succession plans, depth of the technical and management bench, individual performance, strengths, weaknesses and development plans. We build a dynamic list of candidates for important roles around the globe – both near- and long-term. We know personally who they are, how many years they’ve been with us, their roles and paths for development. We have been doing this for 20 years. Last year we reviewed more than 300 of our most promising senior people and an additional 140 critical roles. As I noted earlier, our executives are patiently groomed over a long period and earn their appointments through the demonstration of results, hard work, skills, leadership, commitment to the organization, trustworthiness and character. They come from a deep, multi-generational bench that is of our culture, ensuring continuity of standards and knowledge.
When it works well, that’s what an inclusive meritocracy looks like to my colleagues, to me and to John Keogh, my partner and our President and Chief Operating Officer. By the way, John is a leader who is the embodiment of our culture, and I’m beyond grateful for him. He is a role model to be emulated. I have my shortcomings; John’s strengths compensate for my weaknesses. We’re complementary in that way. I’ve worked with John for more than 30 years and sometimes would have made some pretty lousy decisions without his wise perspective and counsel.
From a shareholder perspective, we have a proven record of compounding wealth over a long period. A dollar invested in ACE 20 years ago would have been worth $9.83 on December 31, 2024, or $98,300 on a $10,000 investment. That same dollar would have earned you $7.18 if you had put it in the S&P 500. Chubb produced a total return to shareholders of 49.7% over the past three years, easily beating the S&P 500’s return of 29.3%.
Earnings accrete to our shareholders through growth in tangible book value, which is the most fundamental measure of wealth creation in a balance sheet business. Last year, our tangible book value grew 12.8%, or 14.1% on a per share basis. Tangible book value per share has grown 10.2% per year on average over three years. Over an even longer period, the last 10 and 20 years, per share tangible book value has grown by 38.2% and 342.2%, respectively, and that includes dilution from the numerous acquisitions we made. We deploy equity capital efficiently, and our operating return on tangible equity was 21.6% in 2024; our operating ROE was 13.9%. Both are well in excess of our cost of capital and an excellent risk-adjusted return.
The Economic, Political and Geopolitical Landscape
We have entered 2025 with a great deal of uncertainty, both political and economic. Growing protectionism, nationalism, geopolitical tensions, as well as change of political leadership and direction, starting in our country, cloud the policy outlook. Tariffs and immigration policy with their potential impact on inflation and growth; on the other hand, taxes, deregulation and our need to address the deficit: We have many competing priorities, and policy coherence hasn’t yet emerged. As we look forward, I am concerned about how all of this, along with the image we are projecting abroad to our allies and partners, will weigh on geopolitical stability, financial markets, and business and consumer confidence, which all seek certainty. U.S. equity markets are priced to perfection and the yield curve is poised to steepen. Major economies are experiencing different growth and inflation conditions, impacting the ability of central banks in these countries to coordinate policy.
Ironically, investment conditions are largely favorable for a company like ours with deep liquidity, longer-dated liabilities and a major buy-and-hold, fixed-income portfolio. As our business has grown, so has our invested asset, from $63 billion 10 years ago to $151 billion at year-end 2024. Higher interest rates contributed to record investment income last year, which represented more than half of our earnings and is a major source of future earnings growth. Inflation and deficits are likely to remain elevated, and government policies may exacerbate that. Given our growing invested asset, higher interest rates and a growing demand globally for private capital, we have plenty of opportunity on the asset side of our balance sheet and an ability to withstand financial market volatility.
While our country has many issues, mostly derived from our politics, I am long the United States, and I wouldn’t easily bet against it. Our economy is dynamic, growing faster than any other major market, and we have an economic dynamism that’s the envy of the world. Private sector innovation and creative destruction drive our economy. We are a nation of laws. We are market-oriented and energy self-sufficient. We have food security. We’re bordered by peaceful neighbors. We have the advantages of a reserve currency and deep capital markets, and, compared to most other countries, we remain a land of opportunity. However, none of these advantages should be taken for granted – they need to be supported and protected.
Annual federal budget deficits near $2 trillion are a serious self-inflicted threat. Fiscal deficits aren’t a problem until suddenly they are. As supply of treasuries grows, demand will ultimately not keep pace. This has implications for interest rates and the dollar. Total debt, which exceeds $36 trillion, is now triple what it was in 2009, and interest on the debt exceeds military spending. It is not realistic to imagine we will simply grow our way out of the problem. In my judgment, the Administration and Congress should establish firm deficit limits as a percentage of GDP, for instance 3%, and force spending cuts. Reducing fiscal deficits would help to bring interest rates down, and that would be stimulative to the economy. A day of reckoning is coming if the problem isn’t addressed.
We are in a period of political change in most Western democracies as voters push back against immigration, inflation, progressive social narratives and global trade. A more conservative and nationalistic brand of politics is growing and pushing back against what’s viewed as elite, liberal and progressive national policies. When leaders look out of touch or arrogant, they are punished.
In our own country, throughout our history, we have tended toward isolationism more often than not. Two world wars and advances in technology and transportation changed that. The growth in our relative size and strength, a globalizing world, our emergence as the global power and our interests that extended beyond our borders brought us both the burden and advantage of leadership. Given global realities, withdrawing and destabilizing our system of alliances is not a good option. Problems will quickly find their way back to our shores and threaten our well-being.
In terms of trade, we shouldn’t ignore reality. The wealth creation model of some major trade partners – including some of our largest allies – creates tensions with our own. In some cases, their model is overly export-oriented, and they run perennial trade surpluses. Their industrial policies feature excessive protection of domestic markets and encourage excess savings, reduced consumption and state-directed investment to support national champions that encourage exports. In some other important countries, crony capitalism protects local monopolies and denies market access. In either case, it is an assault on Ricardo’s notion of comparative advantage, which underpins the principles of a market-oriented trading system.
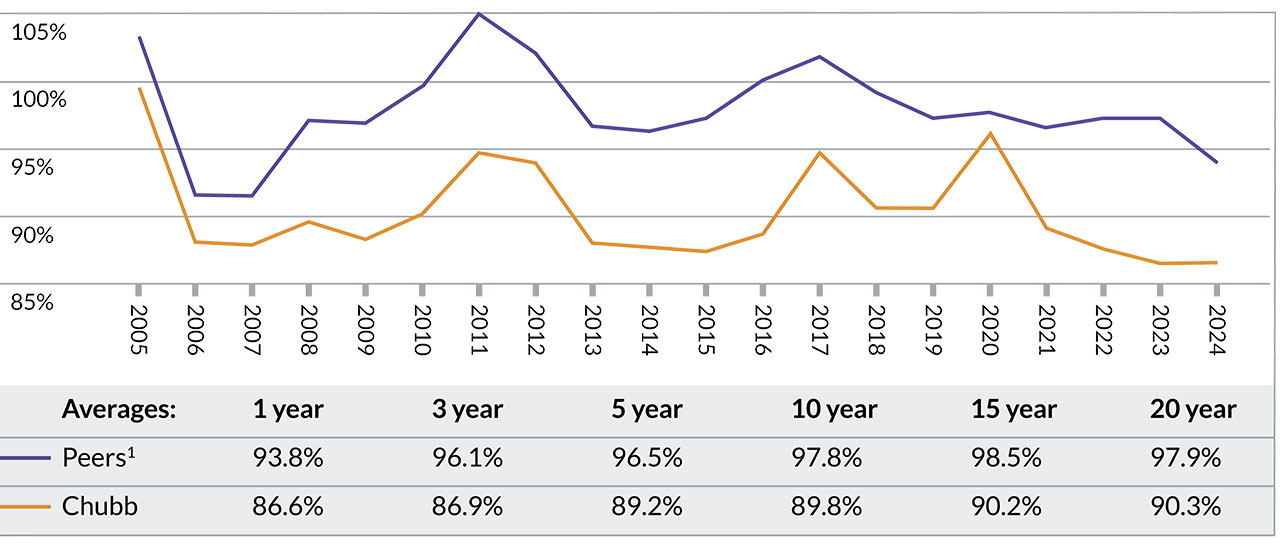
P&C Combined Ratio Versus Peers
The company's underwriting results have outperformed the average of its peers over the last 20 years.
1Includes AIG, ALL, CNA, HIG, Liberty Mutual Group, and TRV
Reciprocity of access and opportunity is a fundamental feature of a sustainable trade system, and we should lead in that direction. That’s the notion behind well-negotiated and actively enforced trade agreements. Trade deficits matter when they are in some significant part a symptom of an asymmetric approach to trade. When it comes to global leadership, trade is an important feature of soft power and influence. In my judgment, we should pursue and truly enforce agreements with other countries that open their markets to our goods and services, including digital. In general, I’m not in favor of tariffs, though they may have a place if used in a thoughtful and targeted way to protect against predatory behavior.
Property and Casualty Insurance for Businesses and Individuals
Property and casualty insurance is Chubb’s core business and one of three sources of future income growth. In 2024, we wrote $55.4 billion in P&C gross written premiums and produced a record $5.9 billion of underwriting income. Generally speaking, underwriting conditions were and are favorable globally.
Our Global P&C business, which includes all of our commercial and consumer P&C businesses excluding U.S. agriculture, grew 9.6%. We grew across all geographies and business segments. Commercial lines grew 8.7% while our consumer P&C businesses, personal lines and A&H, grew 12.1%.
The commercial P&C insurance business and parts of the consumer business, again, are cyclical, with periods when insurance pricing is favorable and periods when pricing is inadequate. Underwriting conditions are growing more competitive in a number of product areas and geographies, though pricing remains adequate. In the U.S. and other major markets, competition is increasing for property insurance for large companies, and that’s true for the excess and surplus lines (E&S), or non-admitted, property market in the U.S. and London as well. Commercial casualty pricing is stable or firming, depending on the class, and overall pricing is keeping pace with loss costs. Financial lines is where more competition is reaching for market share at the expense of current accident year underwriting margin.
Looking forward, I expect the market to remain reasonably disciplined as it grows more competitive, given unrelenting reminders brought by elevated loss-cost inflation in both property and casualty. Broadly speaking, we are in a prolonged period of loss-cost volatility and inflation. Frequency of catastrophe events and increased concentration of values impact the severity of events. Inflated litigation costs, particularly in the U.S., aren’t going away.
While very early days, businesses in America are beginning to react collectively to the problem of excessive litigation, exacerbated by social attitudes, the trial bar and funding by third parties that have turned their bets on jury awards into an asset class. Common commercial auto accidents that once led to $1 million jury awards now produce awards of $10 million and even some as high as $100 million. There is an increasing volume of individual and class action suits costing billions that are based around clever theories designed to find or assign fault where it simply doesn’t exist. On the other hand, there is plenty of appropriate litigation – our court system was built to remedy legitimate wrongs.
Excessive litigation is an unproductive tax on business and on society – it’s a threat to our economic well-being. The U.S. Chamber of Commerce estimates tort costs impose a $529 billion annual tax on economic activity, about $4,207 per American household or 2.1% of gross domestic product. These costs are rising at about 9% annually, materially faster than overall inflation, and much of the money goes to lawyers and funders – only 40 cents of every dollar awarded goes to the plaintiffs. That means the cost of liability insurance is rising at an elevated rate at least as high as legal costs annually. Insurers, major corporations and businesses are beginning to pool their resources to fight for tort reform at both the state and federal level. It will take years to make a real difference. In the meantime, there are battles we can win. My company is putting dollars and talent to work on this important endeavor.
As we entered 2025, about 80% of our global P&C business, commercial and consumer, and our life business have good growth prospects globally. There is plenty of opportunity in front of us. Chubb’s P&C business operates in two principal insurance divisions – North America Insurance and Overseas General Insurance – and a small but important global reinsurance business.
North America Insurance
North America Insurance, our largest business, had another strong year, with commercial and consumer P&C divisions in the United States, Canada and Bermuda writing $36.5 billion in gross premiums. Chubb is the largest commercial P&C insurer in the U.S., serving companies of all sizes with a very broad range of property, casualty, financial lines and specialty products. In fact, we are an industry leader in many areas. We are the #1 insurer for large corporations, #2 for middle-market companies, a top-five E&S underwriter, and the #1 crop insurer in America supporting the farming community. On the consumer side, we are far and away the #1 personal lines insurer focused on high-net-worth individuals and families; in fact, our coverage and services define the category.
Premiums, agriculture aside, grew 8%, with commercial up 7% and personal lines up 11%. North America has grown more than 25% over the past three years, and about 50% over the past five. Our North America combined ratio was world-class at 84.1%, and that’s despite an active and expensive year for natural catastrophes.
North America commercial lines produced $24.7 billion of gross premiums in 2024, offering more than 100 products through more than 9,000 agent and broker relationships. We operate two major North America divisions, one focusing on large corporations, multinationals and the E&S market, and the other focusing on middle-market companies and small commercial businesses.
In the large corporate segment, generally companies with $1 billion or more in annual revenues, we do business with 98% of the Fortune 1000, although it’s often just one or two lines of coverage – so there’s lots of room to grow over time. For large corporations, we both assume and share risk. They are sophisticated buyers with big balance sheets and complex global operations, and they are motivated to either reduce earnings volatility or protect their balance sheets against insurable events. We provide a wide variety of coverages to protect their exposures, and we do it globally – from trucking and logistics to cloud centers and satellite launches, from manufacturing facilities in Mexico or Vietnam to gas terminals on the Gulf. You name it, and we are present.
Chubb Bermuda complements coverage for our largest commercial customers, providing very large limits of coverage that many corporates need. Think liability coverage for pharmaceutical and utility companies. Chubb Bermuda dates back to the founding of ACE in 1985, and we’ve earned a reputation as the #1 provider of excess capacity in that market.
Premium Distribution by Product
2024 net premiums written
We are a leader in insurance for middle-market and small commercial companies, increasingly enabled by our digital capabilities. For middle-market companies, with annual revenues from $30 million to $1 billion, we offer the broadest portfolio of products to cover their needs, regardless of what industry they are in. That’s complemented with experts and risk engineering tailored to dozens of industries, from health care and construction to life sciences and technology. Local presence and distribution are important advantages for us. Insurance is local and conducted between people – and will be for a long time, except for simple products, given the arcane nature of what we do. Our middle-market business grew almost 7% last year, and we are making good progress in small commercial, which wrote about $1.3 billion. We see a lot of room to grow.
Westchester is our North American E&S business, a $4.2 billion division that provides coverage for tough or difficult-to-write risks that admitted markets do not adequately address due to a lack of underwriting expertise or regulatory constraints. It was another success story in 2024, with almost 9.5% growth, especially in difficult areas of risk where traditional property and casualty industry capacity was harder to come by. Our E&S business is also home to niche programs such as pet insurance, where we have a growing business that covers 520,000 furry citizens.
Personal Risk Services (PRS), a $7.5 billion business with 60% market share, is our storied North America high-net-worth personal lines franchise. Premiums grew 11% in 2024. Our PRS clients pay us to meet a high level of service, pre- and post-loss, and we strive to do just that. That’s our reputation. It’s about the richness of coverages, knowledge and capacity to take risk, underwriting and engineering capability, and quality and consistency in claims. We earned a 93% “highly satisfied” customer service rating in 2024 – the top honors – in the J.D. Power & Associates homeowners customer satisfaction rankings. For a sense of our scale, we write more than a million policies each year, and our risk consultants make more than 40,000 personalized client visits.
Most individuals and businesses are in some way exposed to the risk of a changing climate, and our job is to offer more than financial coverage. Our risk consultants and engineers strive to help clients improve their resilience against risk of loss, and our claims team is there when it happens. If you are unfortunate enough to have a personal insurance loss, I hope you have Chubb.
Solutions for a Growing Catastrophe Problem
As I write this letter, the terrible tragedy of the California wildfires has occurred and will likely cost the industry upwards of $45 billion to $50 billion and us $1.5 billion pre-tax. We are paid to take risk and associated volatility, so no tears here. Growing natural catastrophe risk is a problem for society that is not going away. It’s a problem that needs to be managed through a more thoughtful private and public sector approach.
Weather events, large and small, are increasing, and all are temperature and moisture-related: tornadoes, severe thunderstorms and hail, flooding, freezes, wildfires, and hurricanes with more moisture. As well, the concentration of property values has been increasing rapidly for years in CAT-exposed areas, which is virtually everywhere, and people are choosing to live and work right up against nature. Rebuilding costs, due to regulation, standards, labor and materials, are increasing rapidly, further raising the cost of CAT events for society.
The insurance industry incurred $140 billion in insured CAT losses globally last year, and it was a normal year. The cost of the new normal is increasing quickly. Over just 90 days or so in late 2024 and early 2025, a combination of two hurricanes and the California wildfires produced what’s probably about $90 billion to $100 billion in insured losses. And as the cost of catastrophes increases for the industry and society, it is naturally impacting the price and availability of insurance.
The public needs greater certainty of insurance availability, and that begins with regulation that supports an adequate price for the risk. For Chubb, we want a 15% return on capital. Without an adequate return, the private sector can’t attract the capital necessary to cover growing exposures. The cost of catastrophes, and the associated cost of where people choose to live and work, is increasing. Climate change price signals are being broadcast directly through the rising cost of insurance.
The industry doesn’t run a printing press; we intermediate money. When state regulators deny insurers the ability to charge an adequate price and restrict our flexibility to tailor coverage, they drive away insurance availability and foolishly suppress economic price signals, which incentivizes the wrong decisions about where and how people choose to live and work. This ultimately creates a crisis. One outcome is the distortion of a state-funded insurer, meant to provide subsidized insurance for those of modest means and who can’t afford to move. Instead, it becomes the general insurer of first resort for too many. Who pays the bill when that insurer inevitably fails? The citizens of the state pay up front or after the fact; the cost can’t be avoided. This political and regulatory approach is not an economically viable model. Going a step further, attempts to suppress price signals disincentivizes most governments and communities from investing in infrastructure, resiliency and loss mitigation efforts. So many promote unwise zoning and land management practices.
The recent wildfires in California are a tragic illustration of the problem. The state suppressed the industry’s ability to charge a fair price for wildfire-exposed coverage. As insurers reduced their exposures and withdrew private insurance capacity, citizens were offered cheap coverage through the state’s insurer-of-last-resort FAIR plan. Add the enormous time and costs associated with reconstruction post-event due to highly inflated state and local requirements as well as approval and permitting processes. It also doesn’t help that insurers are vilified by government and consumer advocacy groups who, for their own populist and political reasons, tell claimants not to trust their insurers and to lawyer up, which only adds more time and cost to claims settlement. Most insurers are striving to do the right thing and take care of their customers. Counter-productive.
Allowing insurers to adequately charge the right price is the starting point for increasing availability and building a sustainable model. Accounting and tax rules also can be improved to increase the industry’s capacity over time to cover disasters. Current accounting rules allow for insurers to post reserves for natural disasters only after a disaster has occurred. In years when CAT activity is lighter, revenue from insurance premiums collected to fund for larger, more infrequent catastrophes is released to income, and, in turn, the capital account on an after-tax basis. The revenue is treated as profit when, in fact, it’s meant to provision for larger, less frequent events. This isn’t in keeping with accounting practices for banks, which account for the risk of future loan losses when building reserves. The insurance industry should be encouraged to build long-term reserves for more severe CAT events. In simple terms, this change would grow the industry balance sheet – our wherewithal to take risk – and lower our cost of capital, which means damping price increases over time and increasing private sector capital available to cover events. While it isn’t a silver bullet, nor an instant answer, this is a long-term problem requiring longer-term solutions as well.
Local, state and federal governments have a very important role to play: better wildlands management programs and zoning policies, and infrastructure investments that help to mitigate exposures and increase resiliency in our communities. We need permitting rules that don’t unnecessarily increase the cost of reconstruction and the time it takes to rebuild after an event. That would improve affordability, and it would also help people get back to their lives more quickly. State insurers of last resort can serve a need. They should be designed to subsidize insurance, if necessary, only for those most in need – people who live in high-risk areas, can’t afford private sector coverage and can’t afford to move. They are generally called insurers of last resort for a reason.
Serving Agriculture and Energy Needs
Returning to our North America commercial insurance business results last year, Agriculture is a $4.2 billion division insuring crops and farmers’ property and liability exposures. Rain and Hail is the #1 crop insurer in America, insuring more than 100 types of crops and more than 100 million acres of land. Crop insurance is a good example of a successful public-private partnership that underpins the financial health of our nation’s agriculture community. Agriculture is also an example of how technology is impacting everything we do. Data gathered by farm tractors and combines during harvesting provide yield estimates that assist us in adjusting claims. Imagine the efficiency. We’re really proud of our colleagues in Johnston, Iowa, who work to support the American farm community, helping to keep food affordable and abundant.
On another front, we support the need for energy security and a rational transition toward a more carbon neutral economy. We support both objectives through Chubb Climate+, a fast-growing business we created in 2023 for that purpose. The world requires greater amounts of energy as societies develop and this includes the digital revolution. The reality is that we are going to rely on carbon-based sources of energy for a long time, and our company will continue to underwrite oil and gas development and production if done responsibly. Through Climate+, we were the first global insurer to announce methane capture criteria for underwriting oil and gas extraction, and we have expanded the criteria from production through transport. We have recently developed underwriting criteria for other high-emitting industries, such as steel and cement. The criteria require our clients to responsibly limit their emissions, or we won’t underwrite the risk. Chubb risk engineers support our clients in meeting the criteria.
On the other side of the coin, Climate+ is innovating insurance coverages for many new and unproven alternative energy technologies that support a shift toward a carbon-neutral economy, including renewables, thermal energy, batteries, wind farms, solar, nuclear and more. By providing insurance to these projects, risk is reduced, which helps lower the cost of capital and encourages greater investment. Underwriting traditional energy sources as well as new and emerging ones is a growth opportunity globally.
Overseas General Insurance
Our international P&C business, Overseas General, wrote $17.4 billion in gross premiums last year, commercial and consumer. We operate 550 retail branch offices in 51 countries and territories across Asia, Europe and Latin America. We also own and operate a syndicate at Lloyd’s where we are a recognized lead underwriter. Our international general insurance business has been growing quickly, and what an opportunity. Literally, the world is our oyster. Overseas General net premiums grew more than 11% last year, with commercial lines up 9.7% and consumer lines up 13.3%. Growth in our Asia region was especially strong, about 18.5%.
After North America and Asia, Europe is Chubb’s third-largest region overall, with annual gross premiums of $8.1 billion. With a substantial presence in the U.K. and across continental Europe, the region grew 7.3% last year, with premiums on the Continent up more than 11%. In Latin America, we have major operations in nine countries, with Mexico, Chile and Brazil among our largest, and we write about $3.5 billion in premium. Our Latin America region grew 8.4% last year, or 11% in constant dollars.
We write $14.7 billion of premium annually insuring middle-market and small commercial businesses around the globe, and about 40% of this is outside the U.S. The growth prospects are outstanding. After all, economies around the world are made up predominantly of small and medium-sized businesses. Our deep presence – i.e., an extensive branch network in so many countries, together with our scale and capabilities including data and analytics, technology, product and distribution know-how – gives us the ability to effectively compete for local business almost anywhere.
Our international consumer business includes non-life A&H, personal lines and life insurance. Chubb is one of the largest personal accident and supplemental health insurers in the world – a $7 billion global business with more than $5 billion of the premium outside America through our non-life and life companies. We also have a growing international personal lines business that underwrites everything from autos to homes to cell phones. International personal lines premiums were up 22% last year, focused mostly in Asia and Latin America.
As the #1 direct marketer of insurance in Asia, we have more than 7,000 telemarketers, massive consumer databases and powerful digital technology in the hands of a team with considerable marketing and sales know-how. We actively bundle and cross-sell our consumer products. Distribution partnerships with some of the most successful digital companies in the world – including Nubank, ByteDance, Shopee and others – give us access to hundreds of millions of customers.
P&C Premium Growth by Geography
Percentage change in Global P&C net premiums written, 2024 versus 2023 in constant dollars
Our digital unit that serves international consumer, non-life and life, reached a cool milestone last year, surpassing more than $1 billion in premiums, and it generated an underwriting profit. We have rapidly expanded the products and services that we bring to the customers of 240 digital partners, including some of the world’s largest fintech and e-commerce businesses. We have built our native digital business from scratch in six years, and we have plans to grow exponentially in size and profitability.
While early innings, I like the progress we made last year with Huatai Group in China. We have put in place new leadership, updated strategies for each division and made good tactical progress across the three businesses – property and casualty, life and asset management. We’re reshaping the business and strategy around product, distribution, technology, sales capability and expense efficiencies. The economic environment is difficult in China, yet, despite that, we are moving ahead, and each business saw solid growth last year.
Global Reinsurance
We’ve been in the reinsurance business for more than 30 years and were one of the original pioneers of CAT reinsurance, a market that grew out of the aftereffects of Hurricane Andrew in 1992. Reinsurance is a small but important part of Chubb and a book value compounder. We keep it relatively small to limit volatility and concentration while we allocate the majority of our risk appetite to insurance. The leadership team under Jim Wixtead is a highly disciplined group of professionals who have made us money. Global Re had a very good year in terms of growth, with net premiums up 32% to $1.3 billion, as underwriting conditions in the reinsurance markets have become more favorable and have attracted our attention in certain targeted areas.
Life Insurance: A Growing Source of Earnings
Our Life Insurance business is another major source of growth and opportunity. Two-thirds of our premiums come from risk-based products, as opposed to pure savings and asset management types. We have two divisions: our Asia international life company, Chubb Life, and a still small and growing U.S. worksite benefits business, Combined Insurance. Life Insurance premiums were up 18.5% in constant dollars to $6.3 billion in 2024, with growth of 21.6% in Asia, while income rose to $1.1 billion. Chubb Life net premiums and deposits rose nearly 30% to $7.8 billion.
We operate in nine countries in North and Southeast Asia, and direct marketing, brokerage and agency are our primary distribution channels. Let me give you a few examples to bring this to life (pardon the pun). In North Asia – Korea, Taiwan, China, Hong Kong and the Greater Bay Area – we serve a more wealthy and aging population with health and asset preservation needs. Korea is our largest life insurance market, and we are a recognized supplemental health and direct marketing leader. We have companies on the China mainland and in Hong Kong. As Hong Kong and Guangdong Province integrate more closely, the Greater Bay Area, with a population of 86 million and established tech and financial centers, represents a real opportunity for growth. In Southeast Asia – Vietnam, Thailand and Indonesia – dynamic and growing economies have young populations and a rising middle class with limited social safety nets. They have growing needs for accident and health protection and savings to fund family life events such as education and the purchase of a home. Across the entire region, our life business serves 22 million consumers and works hand-in-glove with our non-life business and digital team, again compounding opportunity through product design, distribution partnerships and cross-selling.
We are focused on growing revenue in our life business that produces real earnings. It has become the convention outside the U.S. to measure life company value creation and share price by what is called value of new business, or VNB, which is an estimated present value of expected future profits from new policies written. For me this is a speculative and naïve way to measure value, and I find it a lower-quality, secondary metric. It assumes the future is smooth and predictable. To me, as an operator and investor, what really matters is GAAP and cash earnings as well as growth in quality revenue, meaning products that produce good absolute margin and return on capital.
Meanwhile, in North America, Combined Insurance markets voluntary benefits to the employees of large, midsized and small companies with a product mix that is predominantly A&H focused. This is a $1 billion business that is growing at a double-digit pace, with five million policies in place. This could become a multi-billion-dollar business and real contributor to Chubb earnings over time.
Digital Transformation: On Track and Accelerating
We are well advanced in our strategy to transform our businesses into digital or digitally enabled enterprises over the next few years, an effort that permeates virtually everything we do. Underwriters and claims professionals work more and more in teams with engineers and data analysts in operating the different functional aspects of our businesses. In the past year alone, we hired 1,500 more engineers of all types across the globe, people who are involved in software, data, process, risk – engineering everything.
Wide-scale and more efficient ingestion and enrichment of customer information and broad use of artificial intelligence and analytics are leading to improved customer experience, better underwriting, marketing and claims insights and outcomes, increased speed of cycle times of change and reduced expense. Imagine: We receive about 290 million emails a year, 90 million of which have data-rich attachments. In a short period of time, the vast majority will be ingested into our systems with limited-to-no human intervention.
Importantly, we are using data to better understand and price risk. Insurance, by definition, is about discriminating one risk against another based on its proclivity to loss. Our tools, skills and data are enabling our ability to understand and price risk more finely. Why should one risk subsidize another? The price our insureds pay should more accurately reflect their risk profile.
An Investment Manager with a History of Excellent Returns
As investment managers, we have a long track record of producing excellent risk-adjusted returns. Investment income contributed more than half of our earnings in 2024 and is central to our plans for the future. We have been iteratively diversifying our holdings over the past 10 to 15 years to include more income- and alpha-producing, private, less-liquid assets. Given our strong liquidity and growing invested asset, we will allocate a greater share of our growing investment portfolio to this class of alternative assets.
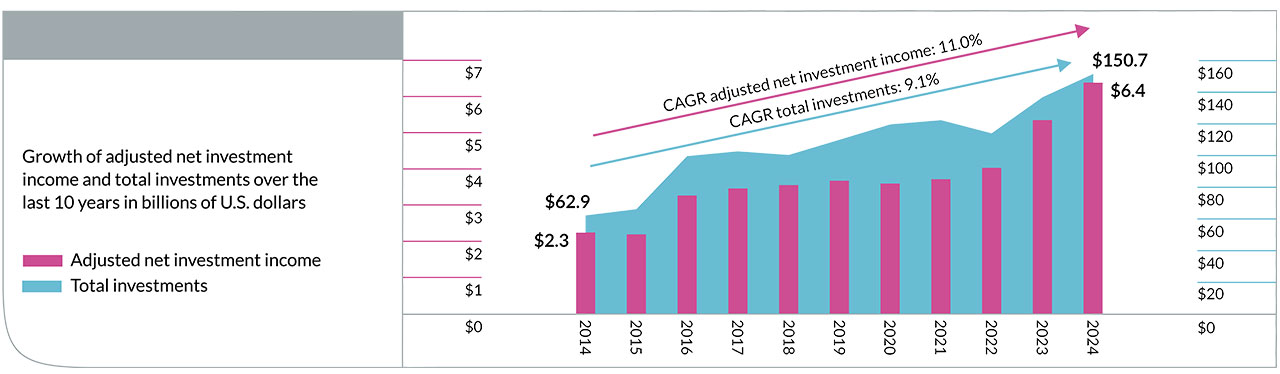
Growth of Invested Asset and Investment Income
Over the course of 20 years, our invested asset has grown from less than $30 billion to more than $150 billion at the end of 2024, and it will continue to expand as our basic insurance business grows. Pick any period during that 20 years and Tim Boroughs, my partner responsible for investing our assets, has produced risk-adjusted returns well in excess of our cost of capital and accretive to operating return on equity. We have grown investment income at a compound annual rate of 11% over the past 10 years and about 20% over the last three years alone.
On the fixed-income side, which is 89% of our invested asset, we’re principally buy-and-hold investors with a high-quality portfolio of A-rated securities. This portion of our portfolio will continue to benefit from higher interest rates. Given economic growth, federal deficits and more persistent inflation, the yield curve will likely continue steepening. That’s the future direction of travel for rates, and that will benefit us. The other 11% is in alternative classes, predominantly private equity and credit.
Under Tim’s leadership, our investment activities are managed by a seasoned team that oversees a limited number of outside, best-in-class partners with deep research, analytical capability and transactional scale. The consortium is tasked with implementing an investment strategy and trading discipline that our team creates and oversees.
As our invested assets grow, we will increase our allocation to less-liquid, private investments from 11% to about 15%, or potentially upwards of $35 billion. Our results over time in our private portfolio have been outstanding, producing a historical cash yield of approximately 8% and an annual internal rate of return of 14.5%. The increase in interest rates should increase future cash yield.
To illustrate a unique feature of our investment approach, approximately half, or more than $7.5 billion, of our private investments are held in Strategic Holdings, established as a holding company with KKR and another partner in 2017. Today total investments in the holding company are valued at $24 billion and produce more than $2 billion in earnings. KKR and Chubb invest on a “pari-passu” basis, meaning we and KKR each invest a dollar of our capital equally. We participate in the governance of the investment process and our investment teams meet biweekly to discuss strategy, review portfolio companies and consider opportunities and prospective investments.
Our diversified portfolio of Strategic Holdings owns controlling interests in 18 companies that we’ve acquired over the last seven years – companies like Arnott’s, the highly recognized Australian cookie and food brands company with operations across Asia; 1-800-Contacts, an industry leader in the field of contact lenses and eyewear; and Heartland Dental, the largest dental service organization in the U.S. We continue to see growth across our portfolio of companies. They are each managed by quality teams, maintain low leverage, generate predictable cash-flow and tend to be less cyclical. These are businesses we plan to own for the long term; think permanently. We are building a conglomerate.
Since inception, the Strategic Holdings partnership has generated an internal rate of return of more than 16% and earns a cash yield of more than 7% that will increase meaningfully in the future. Over the next several years, we envision Chubb’s share of the partnership producing close to $1 billion in operating income with a cash yield of 10-12% on invested capital and annual returns of 14-16%. Strategic Holdings will be a strong and important contributor to our portfolio returns and operating income in the years to come.
Beyond our KKR Strategic Holdings partnership, the demand for patient, private capital is enormous and growing in many sectors, from energy and infrastructure to cloud computing, to name a few. This demand is in the trillions of dollars, and governments have limited wherewithal to fund. We expect that competition for capital will benefit strategic investors like Chubb that have capital to deploy. In total, annual income from our private asset portfolio is expected to increase from about $800 million to approximately $2 billion over the next few years.
The U.S.-China Relationship
The U.S.-China relationship today is without modern precedent. Both countries are advancing rapidly and pushing the boundaries of technological innovation. The gap in relative power, economically and militarily, between the United States and China in comparison to virtually every other country is widening by the year. We both operate within the same international system and are vulnerable to common threats such as climate change, nuclear proliferation, pandemics and geopolitical instability. Breakthroughs in bioscience and artificial intelligence are creating risks and opportunities for both countries. These shared interests cannot be ignored in an evaluation of how the U.S. and China should relate to each other.
Our two countries are in an era of intense and growing rivalry. We each perceive the other as a threat and impediment to achieving our national aims. Both countries have deep cultural and political differences that inform our values and approach to governance.
We distrust each other and view the ambitions of the other as the source of increasing rivalry. Our relationship has grown more unstable. Economically, the U.S. and China have different models for value creation and are in competition. Both are a source of tension. Each country is working to immunize itself against overexposure and dependence on the other. Despite efforts to limit our mutual exposure, the American and Chinese economies remain deeply interdependent; trade is nearly $700 billion annually between us. Companies in both countries are entwined through dense webs of global value chains.
Asia is the epicenter of U.S.-China rivalry. We have competing visions for the future of the region as we vie for leadership and influence. Our country seeks an Indo-Pacific that remains free from Chinese hegemony. We are deeply invested in Asia, see ourselves as a Pacific country and view the region as an important source of opportunity. We are determined to maintain security and stability – in partnership with our allies and partners. China, by contrast, is determined to return to what it views as its rightful historical role as the dominant and central power in the region. It expects countries in the region to grow more deferential to its core interests, including its territorial claims. Beijing seeks greater freedom of movement in the region, and that means weakening or breaking America’s alliance network and undermining the credibility of America’s commitment to our allies and partners.
The competition for influence in the Indo-Pacific is playing out along two axes – economic or national development and security. In my judgment, the U.S. economic model should provide a strong starting point to attract support for our vision of leadership. That means trade agreements. An affirmative U.S. trade agenda is a matter of urgency. However, China is expanding and deepening trade in the region while we are becoming more protectionist.
At the same time, our military edge in Asia is being challenged. China is making rapid military advances. Our country’s alliances and security partnerships are foundational to our ability to provide deterrence, security and stability in the region. However, we are sending mixed signals about our commitment to our alliance relationships. And we are currently not capable of producing the ships, planes, missiles, munitions and autonomous systems at a speed and scale needed to meet security requirements and commitments made to allies.
Globally speaking, neither America nor China is going away. Neither country is capable of establishing primacy over the other, neither is willing to accept a subordinate role, and neither will succeed in fully immunizing itself from the other. I view our contest for leadership and power as relative, not absolute.
In this environment of intensifying and accelerating rivalry, achieving stability in the first instance is of paramount importance. Leadership will be the key as to how the United States and China relate to each other without conflict. Practically speaking, I am hopeful that President Trump and President Xi meet soon to set the tone and direction for the future development of relations. Both leaders should reaffirm their shared determination to avoid conflict. They should work toward establishing principles and a shared framework for managing tensions. They should set the course for how we define our relationship as it is and what it could be.
Both leaders should instruct their militaries to develop more direct, sustained and substantive channels of communication. This could lower risk and strengthen capacity for managing crises. It also is a first step for advancing discussion on strategic stability, including nuclear issues.
Both countries will need to manage and rebalance our economic relations. At present, China overproduces and under-consumes. America is the inverse. I think both sides should consider returning to the May 2019 draft agreement that preceded the phase one trade deal of January 2020. The former was more comprehensive and ambitious in terms of structural reforms and purchases and could serve as a potential starting point.
A Compounder of Long-Term Shareholder Value
I want to thank my colleagues around the globe and our senior management team for their outstanding contributions last year. They are simply the best in the business – talented, dedicated and driven. Thanks to their individual and collective sacrifices, we continue to build a great and enduring company. I also want to thank our active and supportive Board of Directors, whose commitment and counsel have been essential to our success.
Chubb is a compounder of long-term shareholder value; we are a compelling wealth creation story. I am so optimistic about our future and confident that there are many more chapters ahead of us. We have a limitless number of opportunities, ambitious objectives, and the balance sheet, people, capability and patience to deliver. We have come a long way in the last two decades, and I have no doubt that our best days are ahead of us.
On behalf of the entire organization, thank you for your trust in us.
Sincerely,

Evan G. Greenberg
Chairman and Chief Executive Officer
Non-GAAP Financial Measures
This document contains non-GAAP financial measures. The below non-GAAP financial measures, which may be defined differently by other companies, are important for an understanding of our overall results of operations and financial condition. However, they should not be viewed as a substitute for measures determined in accordance with U.S. generally accepted accounting principles (GAAP).
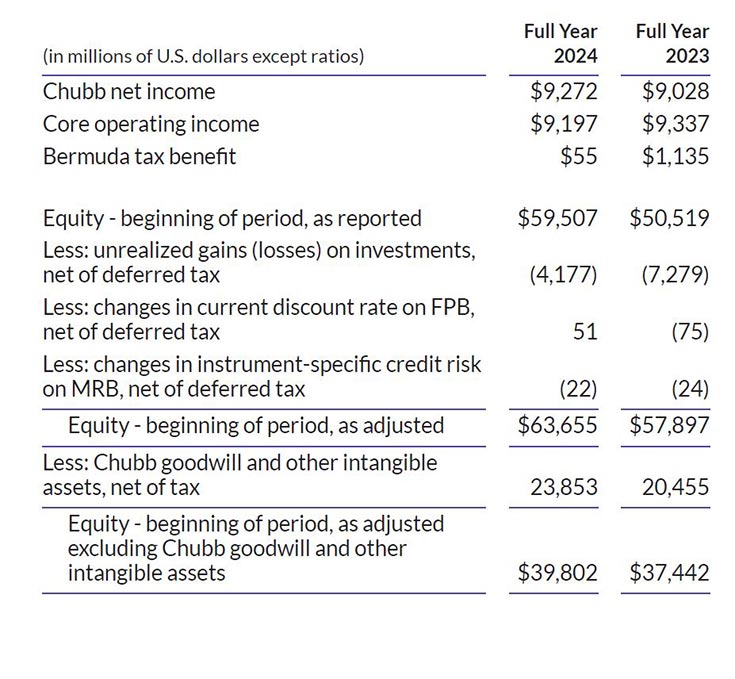
Core operating income, Core operating income per share, core operating return on equity (ROE) and core operating return on tangible equity (ROTE) are also presented excluding the one-time deferred tax benefit of $1.14 billion in the fourth quarter of 2023 and $55 million in the first quarter of 2024 for transition provisions included as part of the enactment of Bermuda’s income tax law (Bermuda tax benefit). We believe that excluding the impact of the tax benefit provides a better evaluation of our operating performance and enhances the understanding of the trends in the underlying business that may be obscured by this one-time item.
Core operating income, net of tax, relates only to Chubb income, which excludes noncontrolling interests. It excludes from Chubb net income the after-tax impact of adjusted net realized gains (losses) and other, which include items described in this paragraph, and market risk benefits gains (losses). We believe this presentation enhances the understanding of our results of operations by highlighting the underlying profitability of our insurance business. We exclude adjusted net realized gains (losses) and market risk benefits gains (losses) because the amount of these gains (losses) is heavily influenced by, and fluctuate in part according to, the availability of market opportunities. In addition, we exclude the amortization of fair value adjustments on purchased invested assets and longterm debt related to certain acquisitions due to the size and complexity of these acquisitions. We also exclude integration expenses, which include legal and professional fees and all other costs directly related to acquisition integration activities. The costs are not related to the ongoing activities of the individual segments and are therefore included in Corporate and excluded from our definition of segment income. We believe these integration expenses are not indicative of our underlying profitability, and excluding these integration expenses facilitates the comparison of our financial results to our historical operating results. References to core operating income measures mean net of tax, whether or not noted.
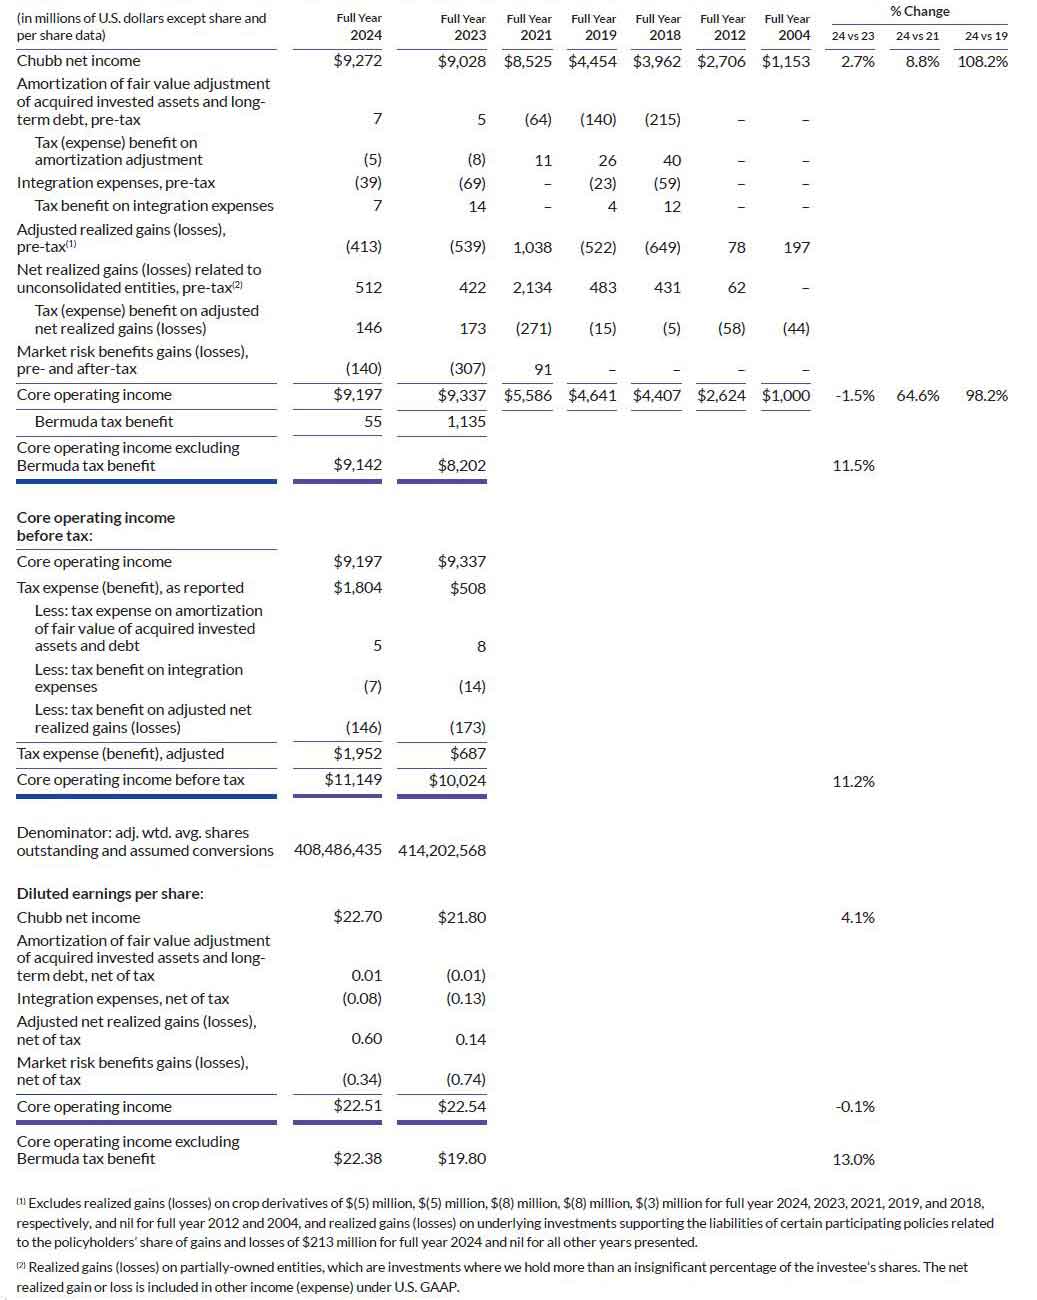
The following table presents the reconciliation of Chubb net income to Core operating income, before and after tax, and Chubb net income per share to Core operating income per share and the growth of each core operating income metric excluding the Bermuda tax benefit:
Core operating return on equity (ROE) and Core operating return on tangible equity (ROTE) are annualized non-GAAP financial measures. The numerator includes core operating income (loss), net of tax. The denominator includes the average Chubb shareholders’ equity for the period adjusted to exclude unrealized gains (losses) on investments, current discount rate on future policy benefits (FPB), and instrument-specific credit risk – market risk benefits (MRB), all net of tax and attributable to Chubb. For the ROTE calculation, the denominator is also adjusted to exclude Chubb goodwill and other intangible assets, net of tax. These measures enhance the understanding of the return on shareholders’ equity by highlighting the underlying profitability relative to shareholders’ equity and tangible equity excluding the effect of these items as these are heavily influenced by changes in market conditions. We believe ROTE is meaningful because it measures the performance of our operations without the impact of goodwill and other intangible assets.
Core operating return on equity (ROE) and Core operating return on tangible equity (ROTE)
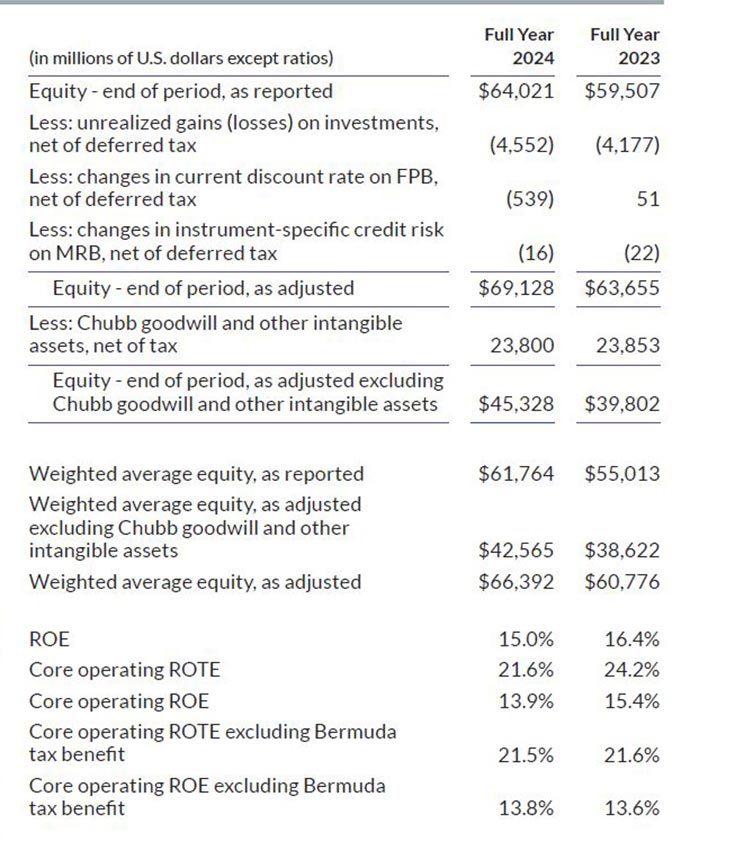
Core operating return on equity (ROE) and Core operating return on tangible equity (ROTE)
Combined ratio measures the underwriting profitability of our property and casualty business. P&C combined ratio and Current accident year (CAY) P&C combined ratio excluding catastrophe losses (Cats) are non-GAAP financial measures. Refer to the Non-GAAP Reconciliation section in the 2024 Form 10-K, on pages 66-69 for the definition of these non-GAAP financial measures and reconciliation to the Combined ratio.
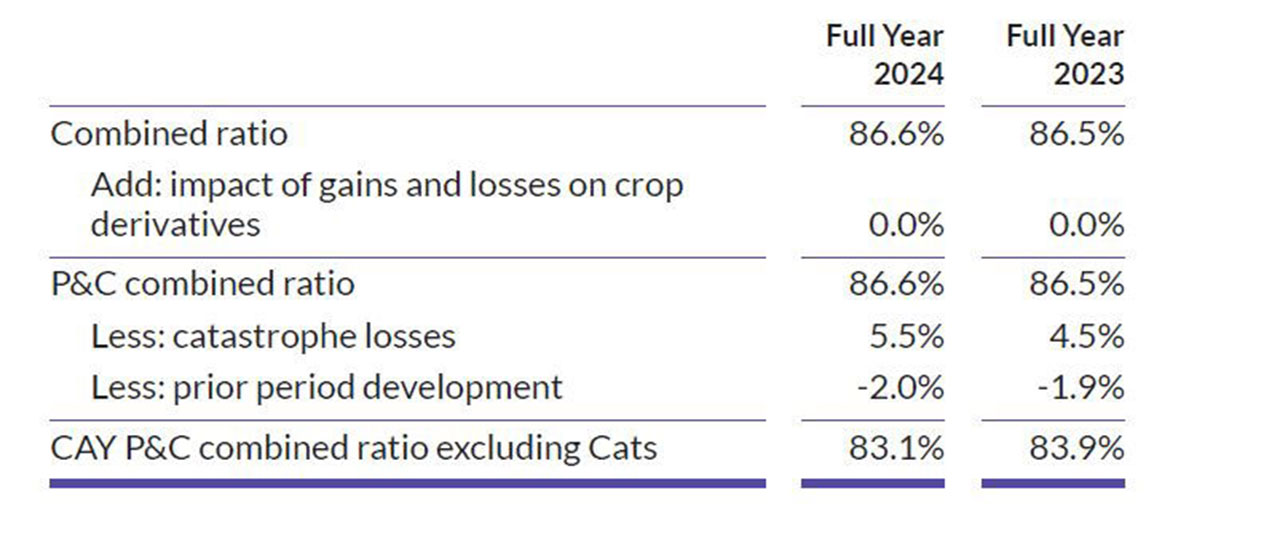
The following table presents the reconciliation of combined ratio to P&C combined ratio, and the reconciliation of P&C combined ratio to CAY P&C combined ratio excluding Cats:
Book value per common share is Chubb shareholders’ equity attributable to common shareholders divided by the common shares outstanding. Tangible book value per common share is Chubb shareholders’ equity attributable to common shareholders less Chubb goodwill and other intangible assets, net of tax, divided by the common shares outstanding. We believe that goodwill and other intangible assets are not indicative of our underlying insurance results or trends and make book value comparisons to less acquisitive peer companies less meaningful.
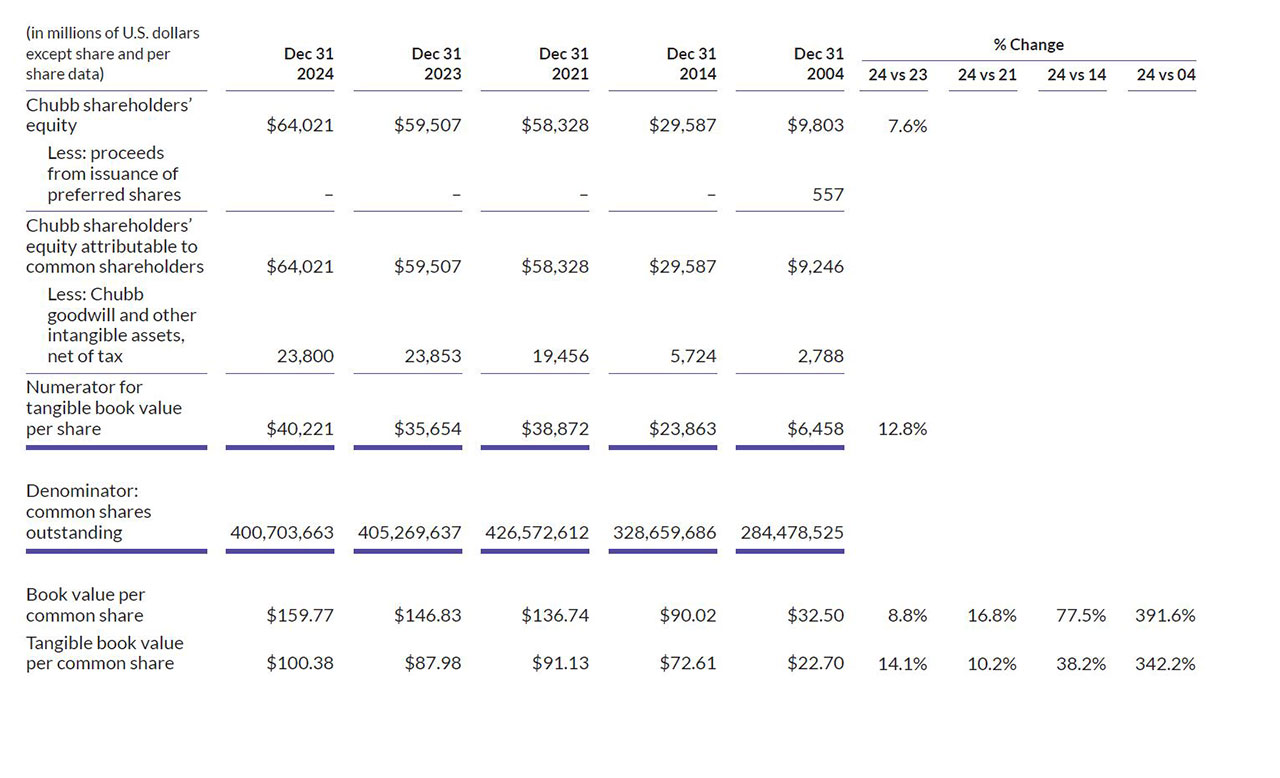
The following table presents a reconciliation of book value per common share to tangible book value per common share:
Book value per common share and tangible book value per common share excluding accumulated other comprehensive income (loss) (AOCI), excludes AOCI from the numerator because it eliminates the effect of items that can fluctuate significantly from period to period, primarily based on changes in interest rates and foreign currency movement, to highlight underlying growth in book and tangible book value.
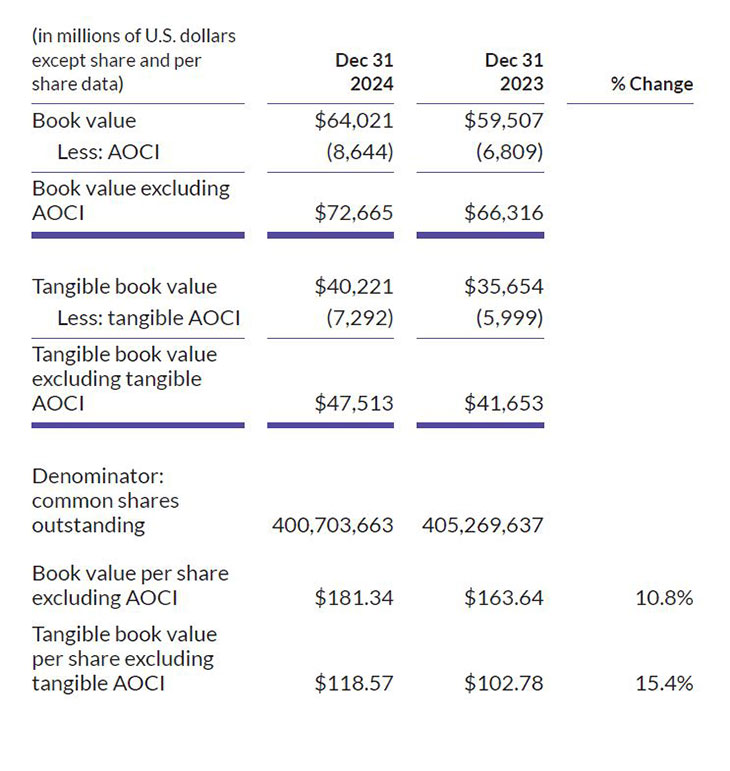
The following table presents a reconciliation of book value per common share and tangible book value per common share excluding AOCI:
Adjusted Operating Cash Flow is Operating cash flow excluding the operating cash flow related to the net investing activities of Huatai’s asset management companies as it relates to the Consolidated Investment Products as required under consolidation accounting. Because these entities are investment companies, we are required to retain the investment company presentation in our consolidated results, which means, we include the net investing activities of these entities in our operating cash flows. Chubb has elected to remove the impact of net investing activities of consolidated investment companies from our operating cash flow as they may impact a reader’s analysis of our underlying operating cash flow related to the core insurance company operations. These net investing activities are more appropriately classified outside of operating cash flows, consistent with our consolidated investing activities. Accordingly, we believe that it is appropriate to adjust operating cash flow for the impact of consolidated investment products.
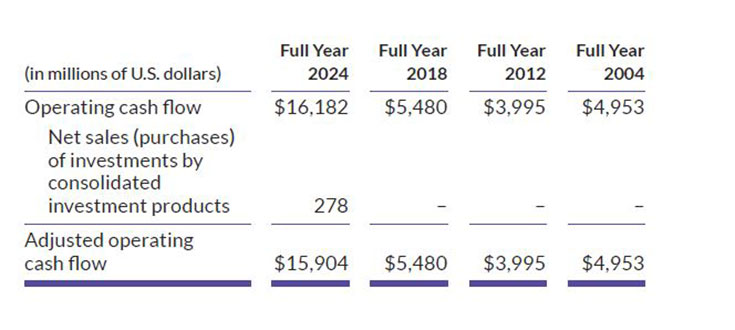
Adjusted Operating Cash Flow
International life (Chubb Life) insurance net premiums written and deposits collected includes deposits collected on universal life and investment contracts (life deposits). Life deposits are not reflected as revenues in our consolidated statements of operations in accordance with U.S. GAAP. However, we include life deposits in presenting growth in our life insurance business because life deposits are an important component of production and key to our efforts to grow our business.
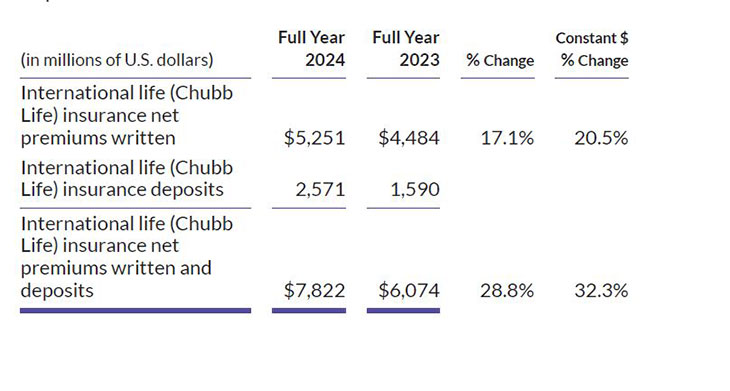
The following table presents a reconciliation of International life (Chubb Life) insurance net premiums written and deposits:
Adjusted net investment income is net investment income excluding the amortization of the fair value adjustment on acquired invested assets from certain acquisitions, and including investment income from partially-owned investment companies (private equity partnerships) where our ownership interest is in excess of 3% that are accounted for under the equity method. We believe this measure is meaningful as it highlights the underlying performance of our invested assets and portfolio management in support of our lines of business.
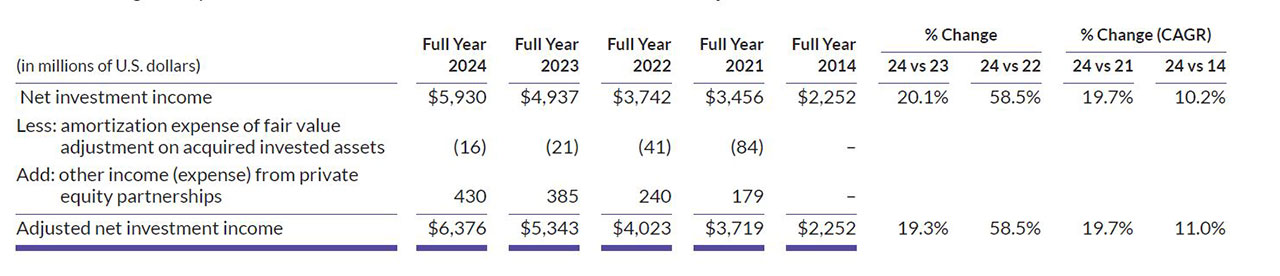
The following table presents a reconciliation of net investment income to adjusted net investment income:
P&C underwriting income excludes the Life Insurance segment and is calculated by subtracting adjusted losses and loss expenses, adjusted policy benefits, policy acquisition costs and administrative expenses from net premiums earned. We use underwriting income (loss) and operating ratios to monitor the results of our operations without the impact of certain factors, including net investment income, other income (expense), interest expense, amortization expense of purchased intangibles, integration expenses, amortization of fair value of acquired invested assets and debt, income tax expense, adjusted net realized gains (losses), and market risk benefits gains (losses).
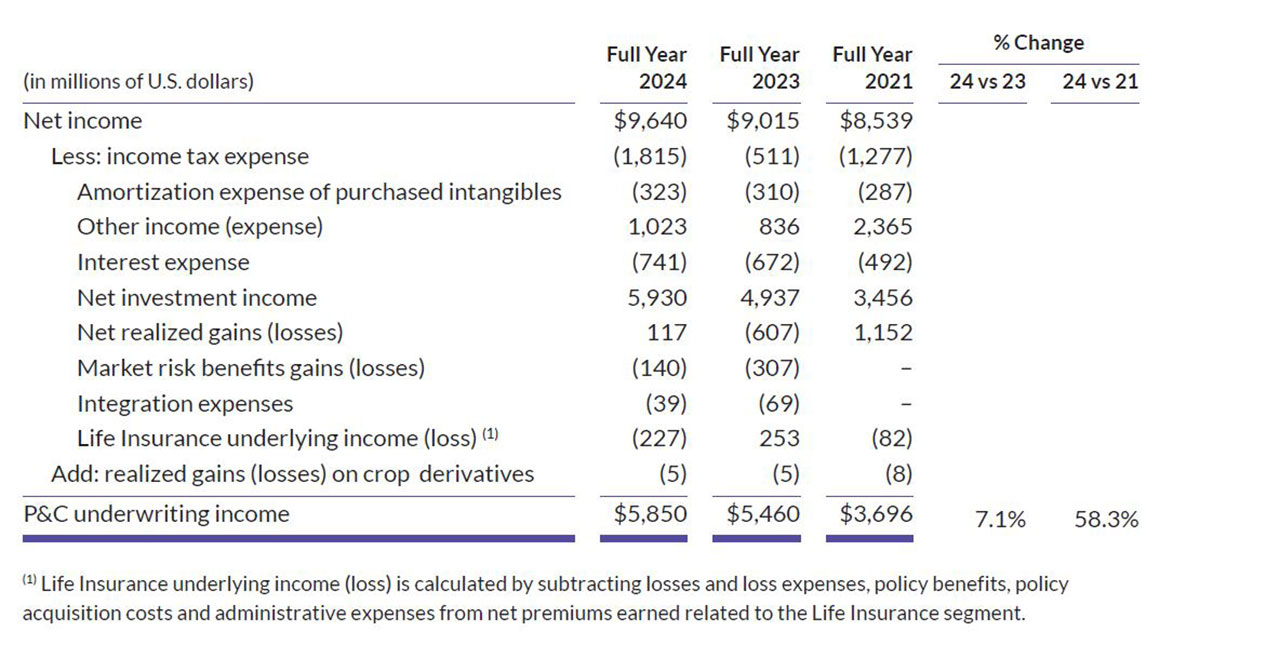
The following table presents a reconciliation of Net income to P&C underwriting income:
Cautionary Statement Regarding Forward-Looking Statements
Forward-looking statements made in this letter, such as those related to company performance, pricing, growth opportunities, economic and market conditions, product and service offerings, commitments, and our expectations and intentions and other statements that are not historical facts, reflect our current views with respect to future events and financial performance and are made pursuant to the safe harbor provisions of the Private Securities Litigation Reform Act of 1995. Such statements involve risks and uncertainties that could cause actual results to differ materially, including without limitation, the following: competition, pricing and policy term trends, the levels of new and renewal business achieved, the frequency and severity of unpredictable catastrophic events, actual loss experience, uncertainties in the reserving or settlement process, integration activities and performance of acquired companies, loss of key employees or disruptions to our operations, new theories of liability, judicial, legislative, regulatory and other governmental developments, litigation tactics and developments, investigation developments and actual settlement terms, the amount and timing of reinsurance recoverable, credit developments among reinsurers, rating agency action, infection rates and severity of pandemics, and their effects on our business operations and claims activity, possible terrorism or the outbreak and effects of war, economic, political, regulatory, insurance and reinsurance business conditions, potential strategic opportunities including acquisitions and our ability to achieve and integrate them, as well as management’s response to these factors, and other factors identified in our filings with the Securities and Exchange Commission (SEC). Readers are cautioned not to place undue reliance on these forward-looking statements, which speak only as of the dates on which they are made. We undertake no obligation to publicly update or revise any forward-looking statements, whether as a result of new information, future events or otherwise.