- About Us
- Climate & Environment
- Our Culture
- Governance
- Stories

Chubb Group Executives

Chubb has operations in 54 countries and territories and can help clients manage their risks anywhere in the world.

The company took its present form in 2016 when ACE Limited acquired the Chubb Corporation, creating a world leader in insurance.

The National Geographic Society and the Chubb Charitable Foundation are partnering together to drive transformational change for vital ecosystems at the intersection of land and water.

Chubb Climate+ draws on our extensive technical capabilities in underwriting and risk engineering, bringing together Chubb units engaged in Renewables, Alternative Fuels, Climate Tech, and Risk Engineering services.

At Chubb, we recognize our responsibility to provide solutions that help clients manage environmental risks, to reduce our own environmental impact and to make meaningful contributions to environmental causes.

Chubb’s culture is defined by who we are, the behaviors we expect of each other, and what we reward and recognize.

Guided by steady leadership and a commitment to the highest levels of personal and professional integrity.


Discover our latest news, insights, stories and profiles
Chubb Limited Letter to Shareholders 2025
Evan G. Greenberg
Chairman and Chief Executive Officer
Chubb Group
- Who We Are: Diverse, Entrepreneurial & Ambitious
- The Chubb Brand and Blue Boundaries
- A Mixed Macro Environment
- An Investment Manager with a Record of Success
- The Accelerating Impact of Technological Change
- How We Manage Hard and Soft Markets
- Scaling Up Our Global Presence
- Plenty of Opportunities for Growth in North America
- Litigation and the U.S. Affordability Problem
- Supporting our System of Democratic Governance
- The U.S. in a More Splintered, Multipolar World
- In Closing
To My Fellow Shareholders
Chubb had an excellent year in 2025, once again demonstrating the enduring value of this broadly diversified insurance company. We produced record operating earnings, supported by strong underwriting and investment results, leading to double-digit growth in earnings per share.
While we’re growing and compounding wealth at a rapid pace, we’re also investing in our businesses and capabilities in the most important parts of the world: North America, Asia, Europe and Latin America. We have been and are embracing the power of technology, AI, data and business process change, transforming ourselves so we thrive for years to come. We have a deep bench of talented, long-tenured leaders who have a passion for creating, building and managing. We are optimistic, our energy level is high, and we are deeply passionate and ambitious about our company.
Twenty years back, I said we aspired to be a great company, observing that to be great is to possess a quality of endurance. It is iterative and takes years, relentlessly building intrinsic strength. Chubb has demonstrated a steady resilience and ability to outperform, regardless of the environment. Over two decades, we have patiently built a broadly diversified, global business, which positions us so well to capitalize on the many short- and longer-term growth opportunities we see around the world. At the same time, our business provides us with resilience to better manage both the cyclical nature of our industry and the inevitable volatility we face in the business of risk.
We are a balance sheet business; therefore, our most important measure of wealth creation is tangible book value, which increased 22.7% last year, or 25.7% on a per share basis. The size and growth of our tangible capital support our ability to grow our underwriting, investment and life businesses. Tangible book value per share has increased 74% over three years and 385% over 20 years, and that includes dilution from acquisitions. As an organization, we are unique in that we have the proven ability to both organically build and successfully acquire and integrate companies that complement our organic growth.
We create wealth through three sources of income, each with vast opportunity to expand and grow over time: 1) We are principally a global leader in property and casualty (P&C) insurance, underwriting risk for businesses and individuals; 2) We are a very successful investment manager with a record of generating excellent risk-adjusted returns on our growing portfolio of invested assets – liquid and private; and 3) We are becoming an established life insurer, with operations predominantly in Asia, and a growing worksite benefits business in the United States, both expanding at a double-digit pace.
Each of these three sources delivered record results in 2025. P&C underwriting income was $6.5 billion, up more than 11.5% for the year and up more than 43% over the past three years. Adjusted net investment income increased 9% to almost $7 billion for the year and is up 73% over three years. Life income was $1.2 billion, up more than 13% for the year and 88% from three years ago. In all, we produced record core operating income just shy of $10 billion – a milestone for our company – up 8.9% for the year and 55% over three years. Operating earnings grew 10.8% per share last year and more than 63% over three years.
Notably, our underwriting results and earnings were achieved in spite of pre-tax catastrophe losses (CATs) of $2.9 billion, about $500 million over prior year, predominantly driven by the California wildfires in the first quarter. Though U.S. and worldwide hurricane and typhoon seasons were unusually light, annual industry insured CAT losses still approached $129 billion. Fire, flood, cyclonic and earthquake were all perils that contributed to industry CAT losses last year. By its nature, CAT exposure is volatile, and frequency and severity of losses are alive and well.
We have built one of the world’s largest insurance companies. As of this writing, we were once again the largest P&C insurance company by market value. For the year we produced $66 billion in gross premiums. While demonstrating significant market presence, this is still barely a rounding error in the large and growing $5.8 trillion global insurance marketplace. Risk is a growth industry, and as an underwriter that helps businesses and consumers manage many aspects of the risks they face, we are capitalizing on a world of opportunity.
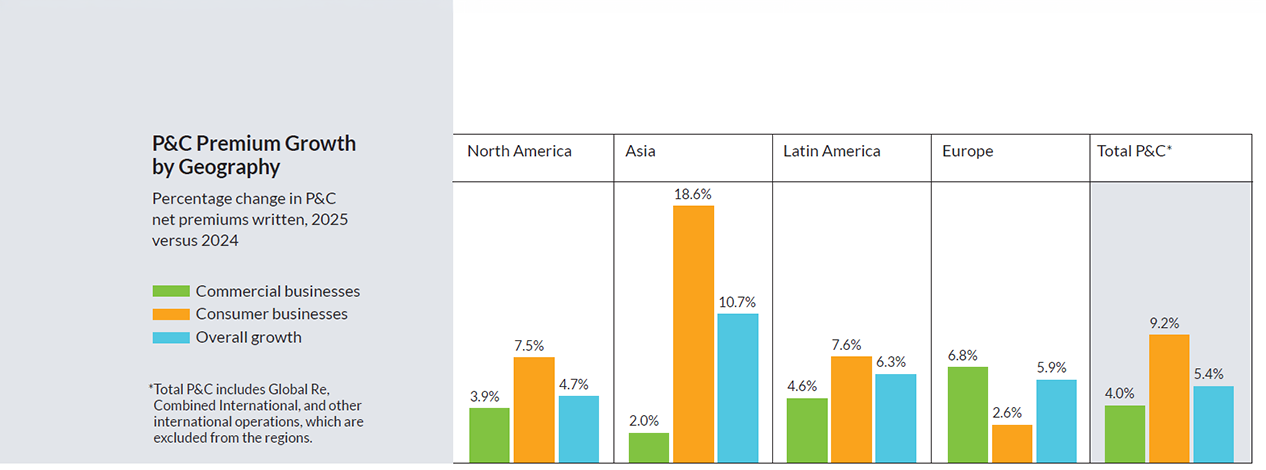
On a net basis – the measure that reflects the premiums and, in turn, exposures we retain on our balance sheet – we wrote $54.8 billion in premiums last year, up 6.6%, including 11.2% growth in our businesses insuring individual consumers and 4% in our commercial-oriented businesses. Every region of the world contributed: North America, Asia, Europe/U.K. and Latin America, with North America and Asia our largest regions. Total net premiums have increased 31.5% over the past three years and more than 62% over five years.
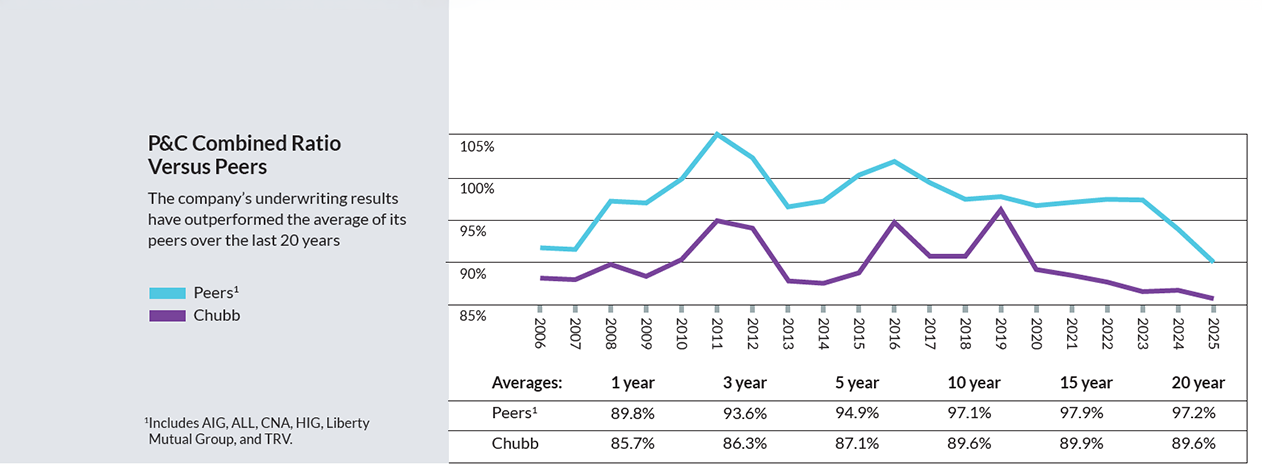
The most important line on our P&C risk-taking scorecard is the published combined ratio, which measures underwriting profit margin. Ours was 85.7% in 2025, which means a profit margin of 14.3 percentage points, an improvement of almost a point from 2024 and a record result. It is about seven percentage points better than our peers over almost any period you measure – 3, 5, 10 and 20 years. On a current accident year basis excluding CATs, a secondary measure that looks through catastrophe-related volatility, our combined ratio last year was 81.9%, a record low.
Through our investments in data, AI, technology and process change, we are gaining greater insight, efficiency and speed in underwriting, claims, marketing, customer service and how we work, while reducing costs. These efforts are seriously intensifying and should significantly benefit our growth and improve margins in the future. I will address this a bit more shortly.
Along with capital, loss reserves are the most important part of the balance sheet – they reflect our wherewithal to pay claims – and over decades we have consistently strived to manage them conservatively. Our reserves stood at $68 billion at year-end and are once again as strong as I have seen them.
As for capital management, our priority is to retain capital to support our insurance and investing operations and to grow our sources of operating income that accrete to return on equity (ROE) and book value. We are balanced and consistent in our approach to capital management, and we regularly return capital to shareholders in the form of dividends and buybacks. In 2025, we returned about $5 billion. We prefer to pay steady, modestly increasing dividends. While we are in the elite category of companies called “dividend aristocrats” – firms that increase dividends for at least 25 consecutive years – we see buybacks as more efficient for investors and the company, if bought at a price below intrinsic value. Buybacks provide us with flexibility in capital management; we are, after all, ambitious builders, and we are in the risk business. Over the past five years, we have returned about $23 billion to shareholders, an average of 58% of core operating earnings.
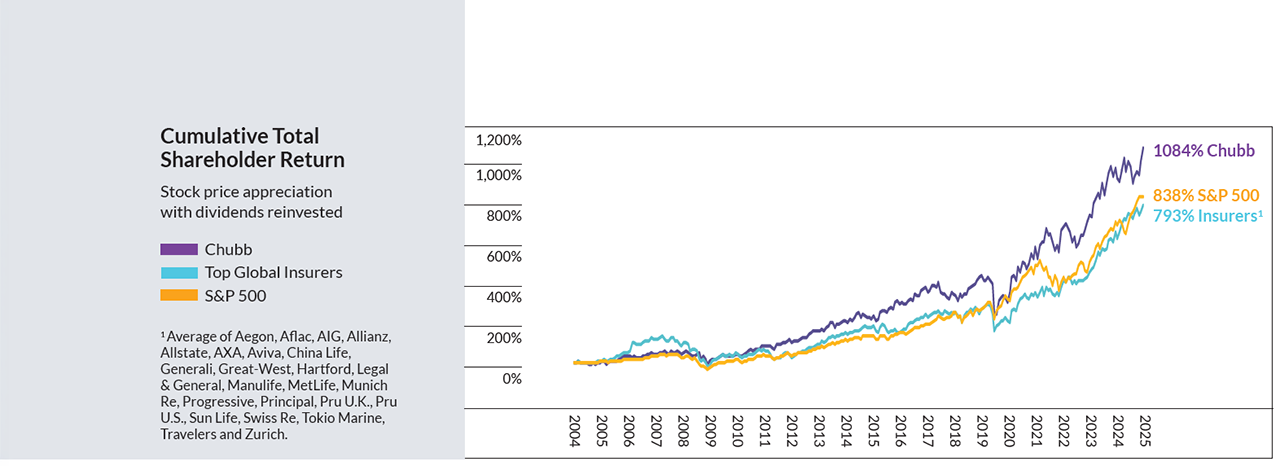
As you see from the chart nearby, our total returns have beaten the market and our peers over the long term. We are, in short, an enduring compounder of wealth. I am more confident, optimistic and energized than ever about what and who we are and about our prospects for the future. We have built a truly distinctive business with the scale, presence, capability and talent to create and capitalize on a large and growing set of opportunities globally.
Who We Are: Diverse, Entrepreneurial & Ambitious
This letter is important to me – it’s personal – since it is my responsibility as CEO to come to account to shareholders about the company we own together. It’s an opportunity to express my views about important issues that matter to many of us and potentially impact the health of your investment in us. The company is forever evolving. This is where I update and describe the firm, including what makes us distinctive and compelling.
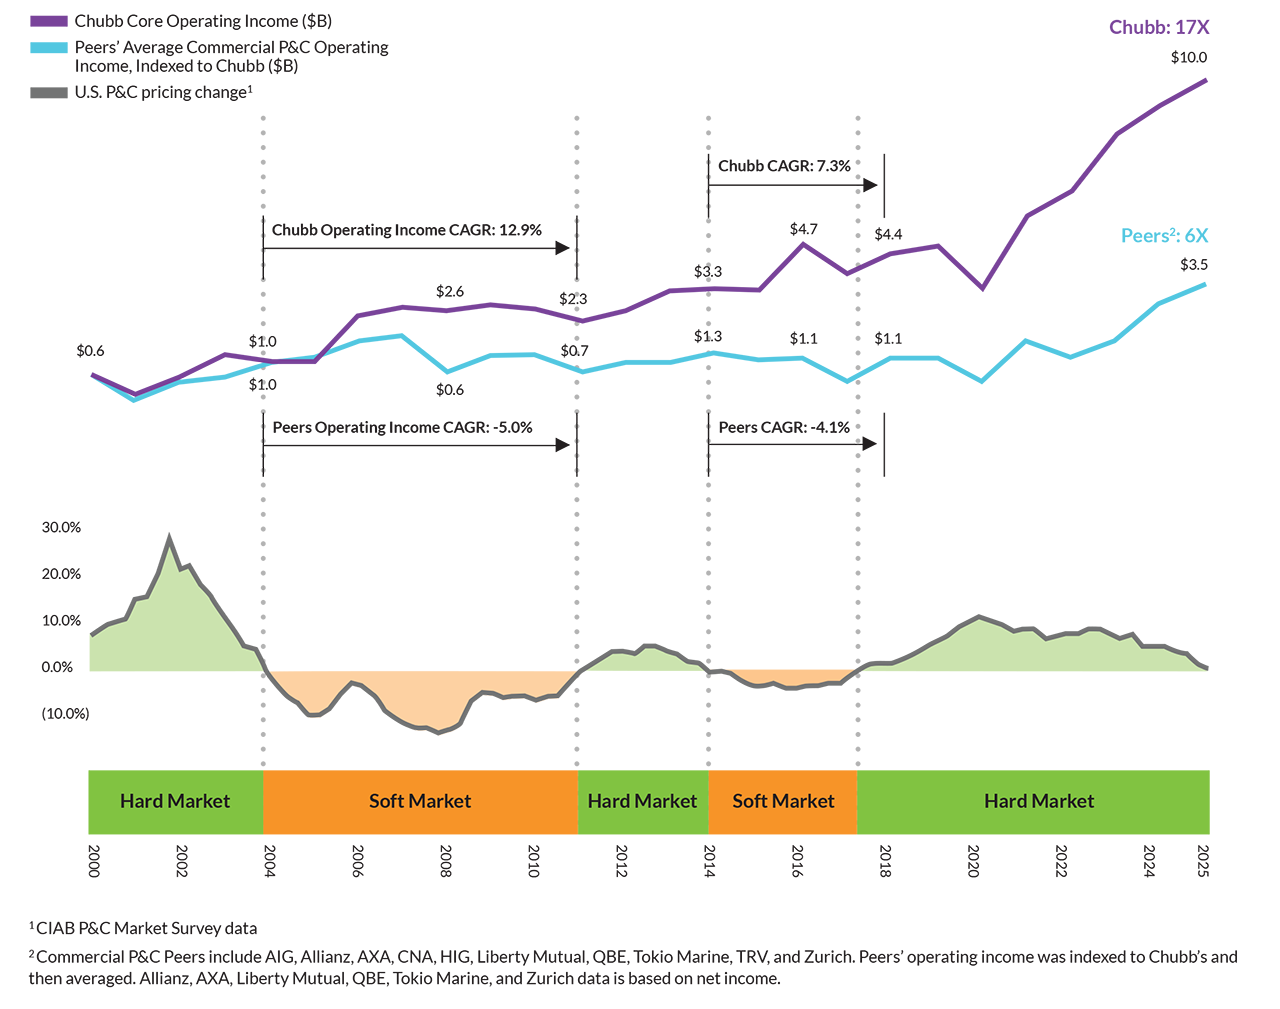
Outperformance over Past P&C Market Cycles
So I begin, as I often do, with the basics. In short, Chubb helps people and businesses manage risk and protect themselves globally. We do this by conceptualizing, assessing, pricing and structuring the risks we assume, and we call this underwriting. Chubb builds and operates businesses all over the world to underwrite and assume risk locally. We have an extensive local footprint, a broad portfolio of hundreds of different insurance products for all kinds of businesses and individuals, and we provide related services that help our customers prevent or mitigate the risk of loss.
We are well diversified by design. We have carefully created, over many years, a substantial presence in 54 countries and territories. This provides greater stability, and our opportunity for growth multiplies as these countries expand economically. When conditions support our expectation for adequate risk-adjusted returns, we grow net premiums, or exposure, aggressively, and that translates to revenue and income. On the other hand, we sacrifice top-line growth and shrink in any of our businesses, even ruthlessly, to preserve an underwriting profit when conditions require. In aggregate, sometimes we grow faster, and sometimes we grow slower. Our results, pictured in the chart on this page, demonstrate superior and enduring income growth and wealth creation over 25 years, through all kinds of conditions.
Well Diversified Franchise – Positioned for Superior Growth
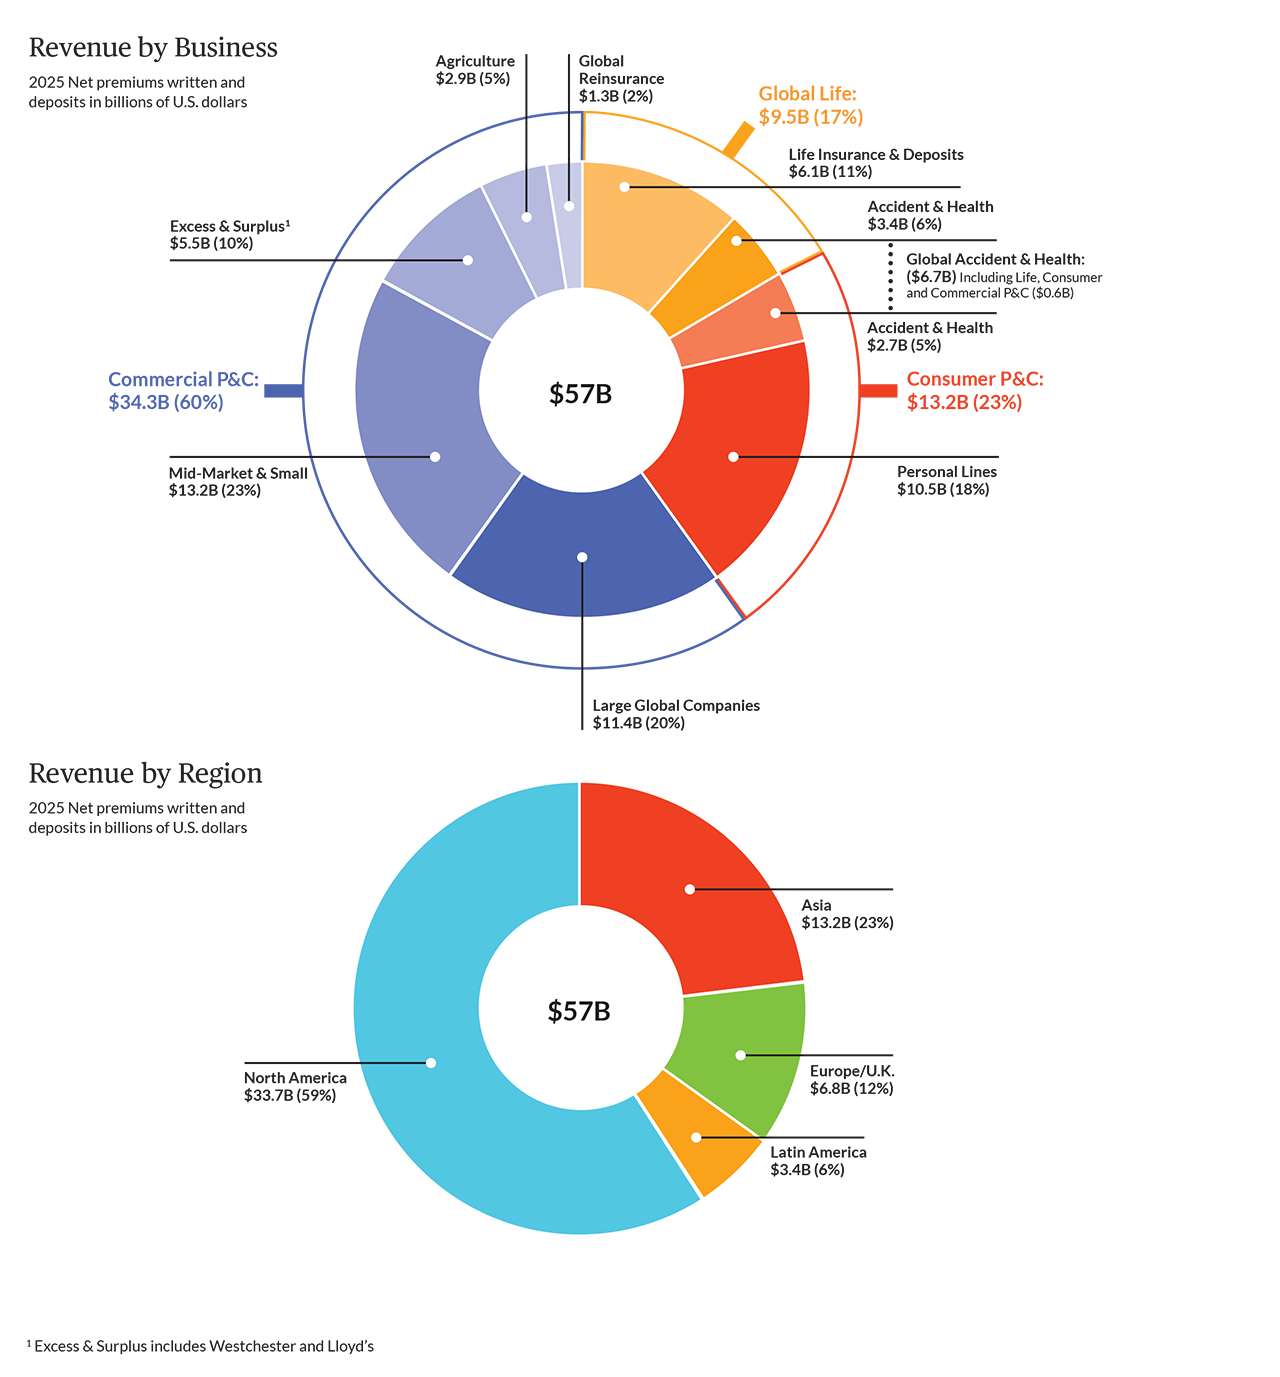
In the charts nearby, you can also visualize the diversification and balance of our company and our mix of industry-leading businesses.
Our commercial insurance operations, which insure businesses, are 60% of our company and serve the smallest to largest companies operating all over the globe. Within that, our businesses serving middle-market and small commercial customers comprise our largest segment – 23% of the company – generating $13.2 billion in premium revenue, and growth prospects are outstanding over time. After all, economies around the world are made up predominantly of small and medium-sized businesses. We are built to compete for business of all sizes by virtue of our deep local presence globally, including an extensive branch network in so many individual countries, together with our global underwriting know-how, scale, data, analytics, technology, product and brand reputation. Nearly two-thirds of our middle-market business is in the U.S., with more than a third outside.
In our major accounts franchise, we are a global leader, specializing in the complex risk needs of large corporations and multinationals anywhere in the world. This represents another 20% of the company, producing $11.4 billion in premium last year. We’re also a leading excess and surplus lines insurer – with $5.5 billion of premium – operating out of the U.S. and London, covering large and small companies exposed to more difficult and specialty risks, and we are the #1 crop insurer in the U.S. Each of these businesses is a major company in its own right.
On the consumer side, we are insuring people and their assets – from the homes, autos, art and jewelry of high-net-worth individuals in the U.S., to the lives, health, autos, homes, electronics, travel needs and pets of middle-income and emerging-middle-income households all over the world. Our global consumer insurance operations, representing 40% of our company, produced $22.7 billion in net premiums plus deposits last year and have been growing rapidly, more than 8% in 2025. In the U.S., we are by far the largest insurer to high-net-worth individuals, with about 60% market share. Chubb is also a global leader in supplemental accident and health coverages (A&H) for middle- and lower-income individuals, and our life operations in Asia are among our fastest growing businesses with a lot of runway for further expansion.
Approximately 45,000 employees operate out of more than 1,150 offices around the globe. Nearly 60% of our premiums plus deposits are written in North America, with more than 40% spread across Asia (23%), the U.K. and Europe (12%), and Latin America (6%). As I have said for some time, in my judgment Asia and North America are the two regions with the greatest long-term wealth creation opportunity for Chubb – and for American business for that matter, a reality that our government should be more focused on, frankly. Together the two regions represent more than three quarters of our company’s premium revenue.
Our hallmark of diversification applies importantly to our distribution capabilities. It isn’t enough to have capital and underwriting expertise. Our global ambitions require the know-how, depth and breadth to reach customers anywhere, in the way they prefer to buy. From the smallest business in Ohio to the largest multinational in London, Australia or China, from a middle-income consumer or business in Thailand to a high-net-worth client in the United States, from an aging consumer in Korea to a younger life insurance purchaser in Brazil – we are marketers with strong distribution capabilities.
Our distribution network spans about 50,000 brokers and independent agents, hundreds of thousands of exclusive life and health agents, and hundreds of direct-to-consumer partnerships through digital and telemarketing channels. In the U.S. we are the #1 or #2 insurer with 15 of the top 20 brokers, and in Asia we are the #1 direct marketer of A&H insurance. Our extensive number of digital partnerships connects us with many of the world’s most innovative social, e-commerce and fintech companies, as well as traditional banks, airlines and others, giving us access to more than a billion existing and potential customers.
Every successful company has a clear understanding of its purpose: To our core we are underwriters and risk takers first. We are led by underwriters who have the training, experience and knowledge to understand and manage risk. We are obsessed with the art and science of underwriting, as well as the management discipline and governance that, in turn, form a culture around our craft. We are well-integrated, with a flat management structure that enables rapid decision-making and granular oversight. When I say well-integrated, that means horizontally and vertically. Ideas and capabilities move around the world, enabling knowledge transfer, while we maintain a strong command-and-control governance process, essential to maintaining discipline in all we do in a vastly distributed organization. We’re micromanagers and hands-on – details are not a burden to us. For all of us, running a business or function at Chubb is an honor and hard work. In our company, the higher you go in management the harder you work.
In any organization, culture is defined by individual and collective behavior. A hallmark of our culture: We aspire, starting with me, to be authentic, regardless of how social and political winds blow. I try to be genuine and frank, not expedient, in my behavior and communication style. That’s what my colleagues expect of me and, in turn, what I expect of them. I know and accept that those on the ideological right and left may not be satisfied in many instances. But I am not interested in politically loaded buzzwords or the latest cause-célèbre. While we aren’t perfect, straight-forward, earnest authenticity is how we’ve always aimed to define ourselves. Another part of the bedrock values of our company: We strive to be a meritocracy.
We groom and develop leaders from the inside. One of those longtime leaders, John Lupica, Vice Chairman, Chubb Group and Executive Chairman, North America Insurance, retired from the company in December after 25 years of standout service. On behalf of all my colleagues and our Board of Directors, I want to extend our deepest gratitude to John, a trusted partner of mine and others in our journey building Chubb into the company it is today. John’s contributions were simply enormous. His leadership, underwriting wisdom, work ethic and exemplary character created a tremendous legacy. John's impact on our culture and the values we hold dear will endure for years to come.
In my letter last year, I said we made several important leadership changes in 2024, including at the top of our two largest business segments – North America and Overseas General – as well as in our Asia-Pacific and Europe regions, and in our U.S. middle-market/small commercial and high-net-worth businesses. In 2025 we also announced a new chief investment officer. The changes were all planned over an extended period and drew from a deep pool of highly talented, long-tenured colleagues, the result of our decades-old succession process. These individuals – Juan Luis Ortega, Paul McNamee, Scott Meyer, Marcos Gunn, Ana Robic, Ben Rockwell and Melissa Scheffler – each have more than 15 years in the industry. Chris Hogan, our new chief investment officer, who has many years of experience, joined us three years ago, and we knew the day he joined he is truly one of us. These are all impressive leaders, operating at a high level, and they are representative of “Chubb character” – of our culture and our ethos. Chubb President John Keogh and I consider them our partners. We have unrelenting, high expectations of them, and our job is to make them better than they ever thought they could be. The combined depth, breadth and continuity of our management team is another hallmark of our company.
The Chubb Brand and Blue Boundaries
Built over the course of more than 100 years, the Chubb brand name stands for reliability, craftsmanship, execution excellence and quality in all we do. In many instances, our customers are willing to pay more for our exceptional service, and we are committed to living up to that reputation.
Last year, my colleague Joe Bear, a Texan and veteran manager in our agribusiness, gave me a cattle branding iron with the Chubb name cast in steel. In an accompanying letter, Joe captured the essence of the term brand and what our name should always stand for: “A brand for a cowboy and in the agriculture world still stands for pride of ownership. It stands for hard work. It symbolizes perseverance and fortitude during hard times. It represents honesty, integrity, loyalty and a foundation to build upon. A brand withstands the test of time in the face of adversity. Forged in fire, it leaves a permanent mark – a lasting impression to be passed down from one generation to the next to be made better, stronger and a part of history.”
That’s wisdom, and it’s how I think of our brand. It is to be nurtured and protected.
The Blue Boundaries partnership that Chubb announced last year with the National Geographic Society is an example of the culture, values and brand I just described. It’s a landmark project aimed at using science to explore, protect and communicate for all to appreciate vital Earth ecosystems around the globe at the convergence of land and water. It is an effort to actively demonstrate the importance, beauty and wonder of nature, which sustains the well-being of the planet. Our natural world faces real and serious challenges that, in turn, affect mankind and many animal species. This effort allows us to help address a problem in a modest way with a truly world-class partner.
The partnership is a seven-year effort between National Geographic and the Chubb Charitable Foundation. Blue Boundaries will focus on studying and safeguarding three of Earth's most vital coastal ecosystems — freshwater wetlands, mangroves, and reefs — through on-the-ground and on-the-water science-based research, film-based storytelling and educational programs. These ecosystems are intricate, interconnected and essential for biodiversity, environmental stability, wildlife and human well-being – vital habitats for nearly half of all species on Earth. They provide fisheries, clean water and coastal resilience, supporting billions of people. And they play a critical role in storing carbon and regulating the climate. However, they are increasingly under threat from climate change, habitat loss, pollution and unsustainable resource use.
We need to better understand and explain what is happening in these areas in fact-based and practical terms, illuminate their beauty and vitality, and help find solutions for the threats they face. I can think of no better or more credible partner than National Geographic. Blue Boundaries, like Chubb, is all about protecting what matters most to us. We are honored to be a part of the project and associate our brand with it.
A Mixed Macro Environment
The economic, geopolitical and financial market outlook is a mixed picture. On the one hand, I am quite optimistic about the year ahead. The economic growth outlook for 2026 is strong, given rapid increases in innovation and massive investments in AI and related infrastructure, which supports current and future growth in productivity. Add to that the stimulus to consumption and capital investment from the tax law enacted last summer, and federal deregulation efforts.
Sitting alongside my optimism are numerous flashing warning lights. Likely, a good portion of the massive amounts of investment going into AI will generate low returns or won’t prove money good. Fundamentals contributing to inflationary pressure are real and growing, including tax cut stimulus, massive deficit spending, lagging tariff impacts, rising electricity demand, immigration-related labor shortages, and large increases in money supply that have contributed to inflation in all asset classes.
We are running federal budget deficits near $2 trillion, 6% of GDP, and total outstanding debt is four times what it was in 2007. That we are running a deficit during a period of strong economic growth is a self-inflicted problem. A reckoning is coming. Our inability – or unwillingness – to control deficits and inflation risks diminishing the confidence of those who buy Treasury debt and other dollar-based assets, which cheapens our currency and raises interest costs. Add a wide range of political and geopolitical uncertainties, and it isn’t hard to imagine a future event or series of events. We can’t predict the timing or the trigger, but the risk is real.
We are managing Chubb with all of this in mind. While we are leaning in, given the many opportunities we see in the businesses we operate, we are maintaining a strong balance sheet, with relatively conservative asset allocation and strong liquidity. Our liquid, A-rated fixed income portfolio – almost 88% of our investments – provides tremendous ballast. And more than 40% of our insurance business is non-dollar, providing a natural dollar hedge.
An Investment Manager with a Record of Success
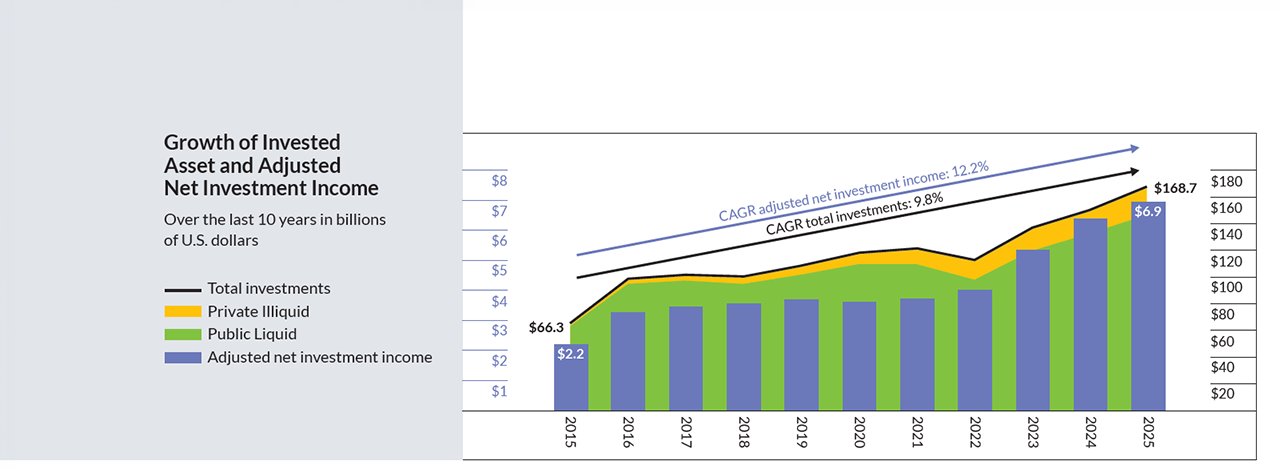
Over the years, on the asset side of the balance sheet, we have built a successful investment business, which is a derivative of our growing, basic business of insurance. Given the size of our invested asset and our earning power, investment management presents a major source of growth and opportunity. Our invested asset has increased from $66 billion 10 years ago to $169 billion in 2025. Investment income represents more than half of our earnings currently and is growing.
Pick any period. We have produced excellent risk-adjusted returns well in excess of our cost of capital and accretive to our operating return on equity. We have grown investment income at a compound annual rate of more than 12% over the past 10 years and 14% over five years. We conservatively manage the fixed income portion of the investment portfolio, which supports our insurance companies’ required capital and loss reserves.
We have, in the meantime, diversified our holdings and built an alternative asset portfolio, where we make private, illiquid investments in credit and equity and, over the last eight years, into our partnership with KKR. Today, half of our private portfolio is in the Strategic Holdings partnership, with controlling or significant positions in a number of companies that share common features: predominantly capital-light, high-quality businesses we want to own for the long term, whose products and services are basic and in demand. They produce sustainable and growing cash flows. Chubb and KKR invest capital equally. We participate jointly in governance, standards, portfolio construction and evaluation of prospective investments. Strategic Holdings is expected to grow significantly in the years to come.
Our results in the private portfolio have been very good over time. The portfolio has produced a 15% internal rate of return for private equity and 9% for private credit, with strong cash yields. We project annual income from the private asset portfolio will increase significantly over the next few years.
The Accelerating Impact of Technological Change
Efforts and investments in our company’s digital transformation are accelerating. It’s a journey we have been on for some time, and we are reaping gains now from years of investment in technology, data and AI, which, in turn, impact how we do business. We are focused on converting our businesses to tech-, data- and AI-driven enterprises. As I noted earlier, this supports increased insight, speed and efficiency in all aspects of the underwriting and claims processes, as well as deeper insights into risk – leading to better underwriting and pricing precision, improved customer experience, wider distribution and marketing capabilities, and new market opportunities. The implications are vast and fundamental, and we are doubling down.
For us, the real story is the coming together of AI (algorithmic and large language models) with foundational technology, data and process reengineering to automate and transform the organization, business by business, at a deeply granular level. This requires engineering talent of different types, working closely together with business professionals and managers who know intimately how the business works and what’s required for change. It requires leadership skilled in actual business transformation. It is iterative, gritty work. It takes time and sustained focus – hard yards. We believe it is the only path to harnessing the real power of a digital age in a large, established company.
In some businesses, tech and AI will replace what humans do entirely; in others it supports and makes them more productive. The firms that manage this well in any industry will create real advantage.
It is also a transformation for our employees, and we are committed to investing in and supporting their journeys as they upskill and reskill. People who embrace progress and are willing to adapt have a career at Chubb. At the same time, we plan to reduce our global employee population significantly. There is a natural annual turnover rate of staff that substantially supports our ability to reduce headcount. While we will need far fewer colleagues in many areas, we require more in certain others. The stronger our competitive profile, the more we will grow, which means more employment over time with higher productivity. And remember, when it comes to most insurance, people still want to deal with people. It’s a trust business.
How We Manage Hard and Soft Markets
The commercial P&C insurance business, and parts of the consumer business, are cyclical, with times when pricing is favorable and times when it is inadequate. The cycle is driven by supply/demand. Demand is relatively constant; it increases naturally as economies and exposures grow. Supply, which is capital, fluctuates. When a crowd of insurers aggressively chases yesterday’s returns for market share, excess amounts of capital are deployed. Prices drop and quickly become inadequate, given the relentless increase of loss costs. Because this is a risk business, eventually undisciplined capital is burned and withdrawn; then prices rise to adequacy again. Cycles can play out over years, considering the lagging nature of our business. In longer-tail classes, you don’t know the true cost of goods sold for years.
Our company has managed through many hard and soft cycles. Our disciplined approach is another hallmark of Chubb. We shrink whole businesses when necessary to preserve an underwriting profit. On the other hand, we take on exposure aggressively when we observe opportunities to earn an adequate return. Many insurers profess discipline, which is easy to say in a hard market, but few mean it. Most are hungry now for growth and are unwilling to trade market share, even when an adequate return can’t be achieved.
Insurance is a large, complex ecosystem. Beyond traditional insurers is a list of other capital providers, starting with reinsurers, who over the last few years moved away from attritional CAT coverage – covering higher-frequency, lower-severity events – to reinsuring CAT tail risk, meaning big and infrequent events only. Given the absence of large CATs the past two years and very favorable pricing, reinsurers entered 2026 with a lot of capital, and rather than return it to shareholders, most are now hungry to put it to work in pursuit of growth.
Many reinsurers, and insurers as well, support managing general agents (MGAs), which is a bad bet in the majority of cases. An MGA is an agent with underwriting authority. (No conflict of interest in that!) MGAs are not new – they have been around for many decades – but during the recent hard market they proliferated. As agents, they don’t retain underwriting risk. Instead, for a commission, they bind others – insurers, reinsurers, hedge funds, private equity – to risk gathered from retail and wholesale brokers who generally do business with them because they offer cheaper prices and good commissions. Often, the MGA also uses a “front” insurance company, whose purpose is to “front” the risk for a fee, take the counterparty risk (don’t worry, no risk there), and then pass it along to the ultimate risk taker through another broker who also takes a commission. This ecosystem also includes broker underwriting facilities, or treaties, that brokers use to lay off coverage automatically to insurers for additional commission.
When you add it up, risk can pass through four or five layers of intermediaries, who all take commissions before the risk finally gets to the ultimate risk taker. It’s a volume-based incentive system that amplifies the supply cycle; all of these intermediaries make their money through commission dollars, which are a function of volume. The clear losers are the ultimate risk takers – cheap prices with huge intermediation costs. It’s also policyholders, because as claims mount and losses build, claims end up paid late or never at all.
We’ve seen this movie before, and it doesn’t end well. Underwriting is the core function of insurers and reinsurers, who are the ultimate risk takers. Insurers who outsource underwriting but retain the risk do so at their peril. There are exceptions in the case of specialist MGAs who earn their income as a share of underwriting profit, but they are a relatively small percentage of this ecosystem. By the way, we do business with a few of them on our terms.
Underwriting is not something Chubb outsources.
At this time, the commercial P&C pricing environment is softening, but it isn’t binary; rather, it is textured and nuanced. Pricing is stronger in some classes and markets (for instance, U.S. casualty related) and weaker in others (like large account and upper-middle-market property, admitted and excess and surplus (E&S), which is now soft). While the market as a whole is transitioning toward a soft part of the cycle, our company is in a good position to grow given our diversification, though obviously not as fast as we did during the hard market. In all, a significant majority of our businesses are less or not exposed to the pricing cycle and present good growth opportunities – some faster, some slower. There is a lot of opportunity in front of us.
Scaling Up Our Global Presence
Chubb’s P&C insurance businesses operate in two principal divisions – North America and Overseas General – plus a small and well-operated reinsurance business. I will return to North America, our largest region, shortly, but first I want to discuss the 40% of our business outside of North America. Our international footprint includes both P&C and life operations, generating $23.4 billion in total premium revenue last year.
Our international P&C insurance business, Overseas General, wrote just over $15 billion in premiums, commercial and consumer, through more than 500 branch offices in 51 countries and territories across Asia, Europe and Latin America. Our retail operations, which are 90% of Overseas General, grew 7.8% last year, with consumer up 11% and commercial more than 5%. The business produced a combined ratio of 85.5%, an improvement of nearly 1.5 points from 2024. We also have a significant wholesale presence at Lloyd’s – the other 10% of the division – as a recognized and well-regarded lead underwriter with a long track record of excellence. It grew about 5.5% last year.
On the commercial side, our businesses insuring small- and middle-market companies in countries around the world produce almost two-thirds of Overseas General’s retail commercial portfolio and are growing quickly, supported by our know-how and capabilities from North America. We are, as well, a leading global insurer for large companies and multinationals, representing the balance.
Our international life insurance business, focused primarily on Asia, is another major source of earnings and growth for Chubb. Life insurance grew more than 15% to $7.3 billion in premiums in 2025 and, again, produced income of $1.2 billion, up more than 13% for the year. Life income has tripled in five years. In North and Southeast Asia, Chubb Life operates in eight countries and territories, and while it has its own core distribution channels, it is working more closely with Overseas General to present a total Chubb proposition for our international distribution partners and customers.
Our Asian operations serve 50 million customers and produced $13.2 billion in total premium plus deposits last year, P&C and Life combined. The region is vast, with many distinct cultures and markets, both large and small, developed and developing. It takes years of patient building and local knowledge to create the depth of presence required to capitalize on the many opportunities we see to serve individuals and businesses across this dynamic region. From supplemental A&H in Korea, to life insurance and asset management in the Greater Bay area of Hong Kong and China, to large commercial in Australia and auto insurance in Thailand, we are built to compete and grow across many unique local markets.
About 80% of our total business in Asia and roughly half of our Asia P&C business is consumer-focused – A&H, life, auto, homeowners and other personal lines – with the balance in commercial lines insuring businesses. Last year, consumer P&C and life premiums were up almost 19% and 16%, respectively, in Asia, while commercial P&C grew 2%.
After Asia and North America, Europe is Chubb’s next largest region, with annual premiums of $6.8 billion. We operate through a substantial network of offices in the U.K. and across continental Europe, with a growing presence in the Middle East. Our business in the region is predominantly commercial, at almost 80%, where we insure large corporations and middle-market companies. In Latin America, we have major operations in nine countries and territories, with Mexico, Chile and Brazil our three largest, and we wrote $3.4 billion in premium last year. We are Mexico’s #3 underwriter of auto insurance. We grew that business almost 18% last year in constant dollars and cover almost 2 million vehicles in the country, another business that is on a roll. In all, in our Latin America region, P&C grew 6.3% last year and more than 11% in constant dollars.
And again, everywhere we operate, we are focused on building and innovating our sales and distribution capabilities. In Asia we have more than 7,000 telemarketers, massive consumer databases and leading digital technology in the hands of teams with considerable marketing and tech know-how. Our “Chubb Studio” technology platform connects us with more than 250 digital partners, including some of the most innovative and successful companies in Asia, Latin America, North America and Europe, enabling us to embed our insurance products and standalone offerings into their digital customer experiences. These partnerships are yet another important source of growth and diversification: Our native InsurTech, Chubb Digital, grew 27% to $1.4 billion last year and earns a meaningful underwriting profit.
Plenty of Opportunities for Growth in North America
Returning to North America, we had a strong year in 2025. Our commercial and consumer P&C insurance divisions in the United States, Canada and Bermuda wrote more than $31 billion in premiums, up 4.7%, with personal lines up 7.5% and commercial up almost 4%. North America has grown almost 20% over the past three years, and 47% over the past five. Our North America combined ratio, at 83.8% in 2025, was simply outstanding and that includes the cost of the California wildfires early in the year. This speaks to the broadly diversified nature of our business.
Built patiently over decades, we are the largest commercial insurer in the U.S., with a well-balanced portfolio of businesses that serve small and middle-market companies, large corporations, hard-to-place excess and surplus coverage, agriculture and farming, and personal lines catering to high-net-worth individuals and families.
Our middle-market and small commercial business division in North America wrote $8.6 billion in premiums last year. Chubb is the second-largest middle-market insurer in the U.S., where we serve companies with annual revenues from $30 million to $1 billion. Premiums have compounded at a rate of about 8.5% over the last five years. This is a huge market. Our local presence, vast amounts of data, breadth of product, unique focus on specific industries, 48 branch offices and large distribution network of agents and brokers add up to a significant capability advantage over most others.
Our major accounts division is the leading insurer in the U.S. of large domestic corporations and multinationals, across a broad range of coverage, from property, casualty and marine, to surety and professional risk, to name a few. Our global scale means we are able to serve our largest customers anywhere in the world. We wrote $7.6 billion in premium last year in North America major accounts. Large corporations have complex risk exposures and require sophisticated structuring, coverage, services and capacity that very few insurers offer. We aren’t just providing capacity for excess layers, like so many others do and where it’s mostly just about price. We are providing capability, which means greater stability in relationships and, to a degree, pricing.
Chubb Personal Risk Services, our business serving affluent individuals and families, is now more than $7 billion in premium and we are far and away the category leader. In fact, we invented the category of coverage and services in the 1980s. The business has compounded at about a 7.5% rate over the last five years. Our range and richness of product coverages, ability to serve the complex needs of these customers, and reputation for service are simply unrivaled. We insure some of the largest, most unique homes in America, many of which are located in extraordinarily beautiful places and are acutely exposed to the perils of nature. We have a 94% “highly satisfied” rating.
Westchester Group, our E&S business, generated $3.9 billion in premium last year. We are a top five E&S insurer in the U.S., offering a broad range of specialty products exclusively through wholesale brokers, who serve large accounts, middle-market and small commercial customers. In 2024 we added pet insurance to the portfolio, another growth business. Westchester has compounded at a 12% rate over the last five years.
Our agriculture business, Rain and Hail, formed in 1919, is the #1 insurer in the U.S. dedicated to protecting the crops of American farmers. This is a CAT-like business with a favorable risk-return profile when managed well. Rain and Hail has a deep competitive advantage given its scale, national presence, 100 years of farmland data and advanced technology. The business produced $2.9 billion in premium in 2025.
Finally, Combined Insurance, a part of our Life division now operating under the name Chubb Benefits, provides voluntary benefits to the employees of large, mid-sized and small companies with a predominantly A&H-focused product. The business grew 17% in 2025 and now generates $1.2 billion in premiums.
Taking this brief trip around the world, you get a glimpse of the diversification and balance of business that we bring to bear.
Litigation and the U.S. Affordability Problem
We have a growing affordability problem in the U.S., which is also a political problem. One source is the cost of litigation, which is contributing to price increases in just about everything – transportation, food, construction, insurance and more. Our legal system is an unnecessary tax on society that saps households of an average $4,000 annually, more than 2% of U.S. GDP. The exploding frequency and cost of litigation for businesses of all kinds is raising liability insurance costs about 7% to 9% a year – multiples of the inflation rate.
As the largest commercial insurer in the U.S., we see firsthand on a daily basis how our nation’s litigation problem is worsening and out of control. You see it, too: Trial lawyers on billboards everywhere promising big paydays for all forms of injury, a chance for your day in court – and then there is the explosion in mass class action lawsuits. Partially fueling individual and large tort cases is the growing litigation finance industry – private equity investors, as well as hedge funds and substantial foreign money – which funds lawsuits in exchange for a piece of the awards. They’ve turned courtroom payouts into a speculative asset class. But there’s no free lunch. The cost of liability insurance is rising along with the cost of litigation. Insurers intermediate money, we don’t print it.
The trial bar is a money-making growth industry, and it continues to expand as lawyers search for new theories of liability to bring more lawsuits. Employment practices liability (EPL) is an example of how the litigation problem is metastasizing; EPL lawsuits are increasing at a double-digit rate nationally. Employees are suing employers for harassment, discrimination, rights violations, and now mental stress. Corporate return-to-work policies, for example, are now grounds for personal injury action, based on the novel legal theory that such policies cause compensable mental stress.
The business community is starting to get its act together and fight back against abuses of the system, and we are making some progress. Georgia, South Carolina, Florida and Louisiana have enacted important tort reform laws that are making a difference, while several states have enacted or are considering laws requiring disclosure at trial as to who is funding the lawsuit. At the federal level, legislative efforts are underway in Congress to partially address the problem of litigation finance nationally. It is important movement and good news, though modest relative to the rising cost of excessive litigation on society and the economy. It’s a cancer. I expect business community efforts to pick up steam in the year ahead as more corporations are waking up to the problem and joining the battle to bring greater rationality and balance to our legal system. It will be a long fight.
Supporting our System of Democratic Governance
U.S. economic growth is strong, but fewer Americans believe they are benefiting. Wealth is increasingly concentrated among a relative few. Economic growth is not equaling broad-based prosperity. Middle- and lower-income citizens earn more money than ever, but the cost of living has outpaced their gains in income. They struggle to afford a decent way of life. More younger people question whether hard work will create opportunities, and there are increasing demands for entitlements – a belief that government should offer subsidies to redistribute wealth and mitigate unfairness in the system. Distrust of institutions, both public and private, is rising. More people are questioning whether a democratic system of governance and self-reliance is the right system for America, or whether government should be more muscular and autocratic. There is rising polarization and populism on the right and the left of the political spectrum, while the center is more silent.
For many, there appears to be an illusion of permanence in our country’s democratic institutions. But our system of governance is a grand experiment that is not simply self-sustaining. It has been held together by a reasonably predictable and transparent legal system, checks and balances between branches of government, respect for private ownership, free and fair elections, and a collective and individual sense of personal responsibility that supports our exceptional ability to grow and prosper.
At our best, we all rise as a country to a self-conception as “the land of the free and home of the brave.” We have a responsibility as citizens to participate in our self-governance. Civil society is a participant’s sport; we require our leaders to set an example and to respect and protect all of our rights.
There is and always has been a danger that our politicians and private sector leaders choose to rationalize support for policies that challenge their beliefs and look away from decisions that conflict with our national values in order to stay safe and secure patronage. Many choose silence and appeasement over pushback. These behaviors simply embolden leaders and further undermine democracy by breeding distrust and a lack of respect for leadership broadly among citizens.
As a country, our history is about endless effort and, at times, struggle to achieve and maintain a vision of democracy. Our independent courts and media have worked to keep our leaders in check and protect the bedrock principle that nobody is above the law. Congress has actively guarded its role as a co-equal branch of government. And the American people have demanded respect for their constitutional rights. Our Supreme Court has remained active and balanced – a strong example of our constitutional system at work. I am optimistic for our country, but it’s our collective responsibility to actively support this grand experiment in democratic governance for it to endure.
The U.S. in a More Splintered, Multipolar World
For some time, the international order has been shifting, from a U.S.-led post-World War II system toward a more splintered and multipolar world. Other countries and regions – most notably China, but others, too – have been and are amassing a larger share of global economic, diplomatic and military weight. Our country is hardly declining, but power is naturally becoming more dispersed.
However, of late, the shift has accelerated. Our country’s leaders are less constrained by consideration of traditional norms, institutions and alliances. Our economic and military power has been used to advance a more aggressive and expansive view of our national interests. In policy, we have become more transactional, driven to a degree by perceived opportunity and grievance. We seem to be in a constant search for leverage against allies and others equally.
The foreign policy shift is most evident in our hemisphere, where we seek to reassert greater dominance. In Europe, we have rightly pressed allies to assume a far greater share of the burden for their own defense, though we have also interfered internally, pressing them socially and politically to preserve their national identity by “protecting” free speech and limiting immigration. Of late, in both Latin America and Europe, we have pressed to extend our extraterritorial rights over land and natural resources.
While we have grown more assertive in our hemisphere, there is no evidence we are withdrawing from other regions of the world, contrary to views I sometimes hear expressed. We remain influential, strong and active in Asia and the Middle East. And to date, the administration has not shown interest in ceding areas of influence to Russia and China. However, it seems to me that our approach in our hemisphere raises the risk Russia and China could seek to follow our example in their regions.
As I finish this letter, we have commenced military action against Iran. Though the action carries a great deal of risk and uncertainty, the status quo was unacceptable and unsustainable. For 40 years Iran has been calling for “Death to America.” Its nuclear ambitions and its support and funding of terrorist organizations pose real threats to our security, and the security of our allies.
In Asia, we are redefining our relationships with allies and partners by insisting that they provide greater economic benefit to us as a price for security protection. Meanwhile, we have also emphasized the importance of strengthening military deterrence while concurrently lowering tensions with China, a good direction.
The gap in overall national power between the United States and China versus every other country in the world is sizable and growing. Our two countries stand apart in the combined military, economic power and population size each possesses. Other countries have one or two of these features, but not all three.
U.S.-China relations have stabilized over the past year, and we are in a period of relative tactical calm as a result of our president’s personal diplomacy and the mutual respect created between our two leaders. Left unsaid but acknowledged by both is the fact we each remain uncomfortably vulnerable to the other as a sole source or critical supplier. We depend on China’s rare earths, in addition to batteries, pharmaceutical ingredients (APIs), and the refining of raw materials. China similarly depends on us for advanced technologies and software, aircraft components, high-end machinery, etc. If either country chokes off the other, it invites retaliation. Both leaders are acutely aware of this reality. At the same time, institutional and national distrust are extremely high, and both countries are actively working to insulate and distance themselves from the other. Ironically, our president, almost alone among U.S. political leadership, supports greater engagement without compromising our interests. I applaud that.
We will hopefully extend the period of relative calm over the next year. This would buy time for both countries to modestly reduce sole source dependencies. While we won’t change the long-term direction of the U.S.-China competition, we can use this period to begin reaching agreements in the areas of trade, investment and security, both military and domestic. Given the domestic political realities in both countries, potential agreements will likely be modest in nature, but even that would begin to get us in the habit of greater engagement and cooperation – a trend that would be mutually beneficial. In the longer term, for the sake of our own prosperity and security, and that of the world, the U.S.-China relationship must be defined by cooperation, competition and engagement, without compromising our respective national interests. The stakes are too high and the world too small.
More broadly, as international rules and norms are diminished, constraints on the use of force to achieve national goals are diminishing. Our allies are forced to face reality and depend less on the United States for their security and prosperity. Our global network of alliances, traditionally a source of strength and influence, is beginning to decrease.
Middle and smaller powers will begin to exercise greater agency to protect their interests and turn toward each other for mutual support. Over the coming years they will increasingly seek to work together and address shared challenges. Their efforts will be both informed and limited by their respective interests, size, geography, cultures and values. In my judgment, this will hardly represent the dawn of a new geopolitical era. The world won’t reorganize itself in the absence of the leadership of a strong country — or countries — capable of compelling others to sacrifice their immediate interests in the service of a global vision or order.
In Closing
Our company’s many qualities are distinguishing. I hope you have come away with a better appreciation that this is by design and is reflected in our performance.
I want to thank my colleagues around the globe, including our senior management team, for their outstanding contributions and their enduring commitment to our mission. I am honestly lucky to work with the best – people who are talented, dedicated and driven. Due to their collective efforts, we continue to build on what is already a great company. I also want to thank our active, supportive and optimistic Board of Directors, whose commitment and counsel have been essential to our success. They give us added confidence to do what we do best: create, build and manage.
Built over years, Chubb is a durable compounder of long-term shareholder value with a compelling wealth creation story. We have so many opportunities, ambitious objectives, and the balance sheet, people, capability and patience to deliver – and I have no doubt that our best days are ahead of us. On behalf of the entire organization, thank you for your trust in us.
Sincerely,

Evan G. Greenberg
Chairman and Chief Executive Officer
Non-GAAP Financial Measures
This document contains non-GAAP financial measures. The below non-GAAP financial measures, which may be defined differently by other companies, are important for an understanding of our overall results of operations and financial condition. However, they should not be viewed as a substitute for measures determined in accordance with U.S. generally accepted accounting principles (GAAP).
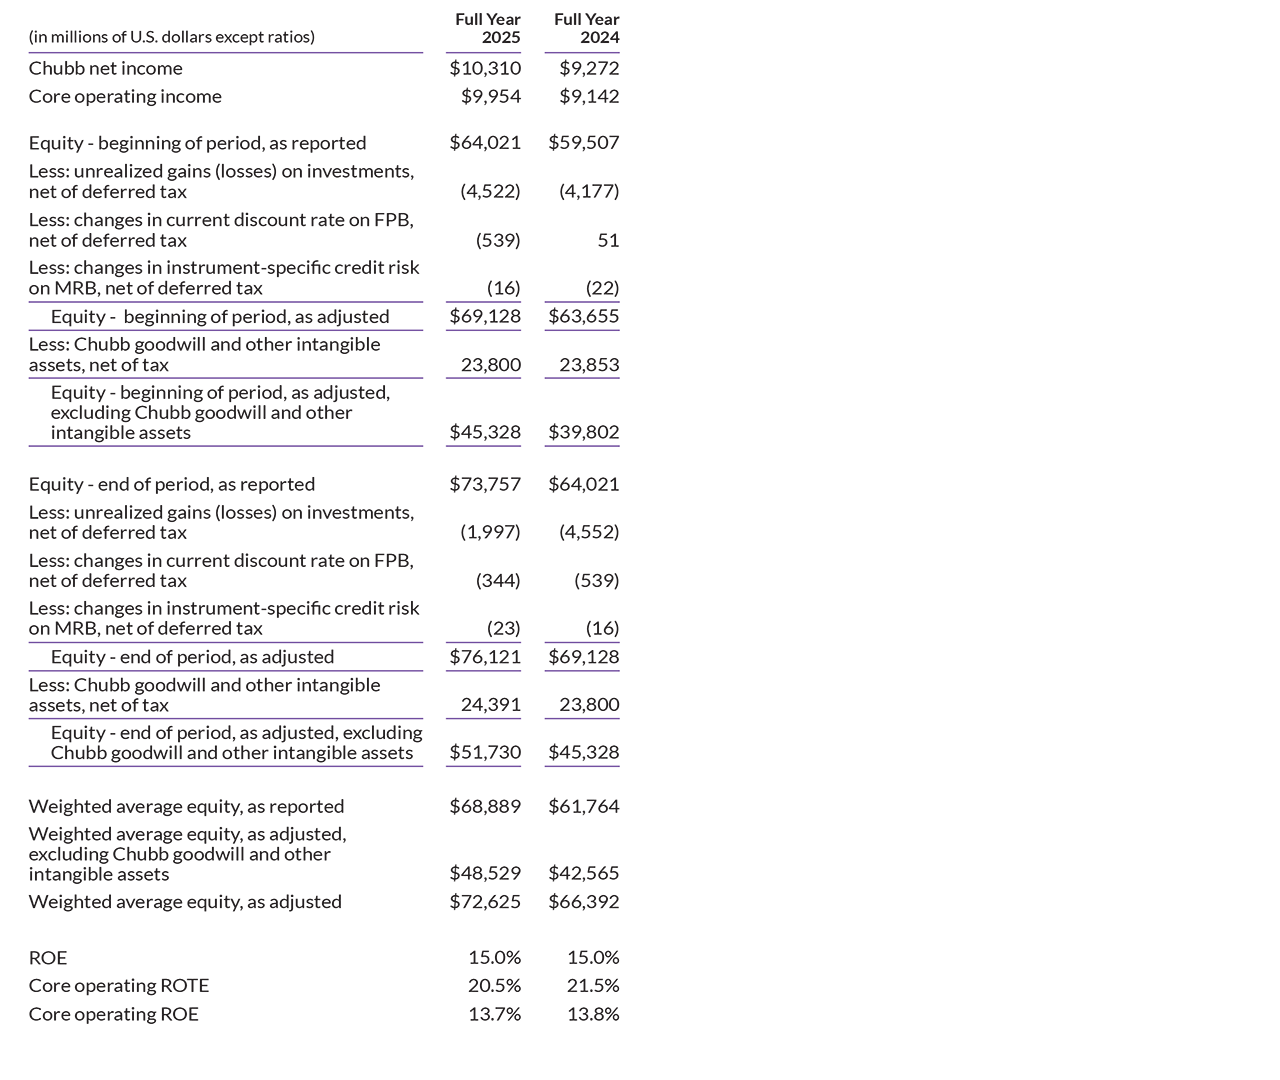
Core operating income relates only to Chubb income, which excludes noncontrolling interests. It excludes from Chubb net income the after-tax impact of adjusted net realized gains (losses) and other, which include items described in this paragraph, and market risk benefits gains (losses). We believe this presentation enhances the understanding of our results of operations by highlighting the underlying profitability of our insurance business. We exclude adjusted net realized gains (losses) and market risk benefits gains (losses) because the amount of these gains (losses) is heavily influenced by, and fluctuate in part according to, the availability of market opportunities. In addition, we exclude the amortization of fair value adjustments on purchased invested assets and long-term debt related to certain acquisitions due to the size and complexity of these acquisitions. We also exclude integration expenses, including legal and professional fees and all other costs directly related to acquisition integration activities, as well as severance expenses associated with transformation initiatives to enhance operational efficiency. The costs are not related to the ongoing activities of the individual segments and are therefore included in Corporate and excluded from our definition of segment income. We believe these integration expenses and severance are not indicative of our underlying profitability, and excluding these integration expenses and severance facilitates the comparison of our financial results to our historical operating results. Additionally, we exclude the non-recurring tax benefit from the Bermuda Economic Transition Adjustment enacted in 2023 and adjusted in 2024 and subsequent years’ amortization of the related deferred tax asset, which we believe provides investors with a better view of our operating performance, enhances the understanding of the trends in the underlying business, improves comparability between periods and provides increased transparency compared to the prior presentation of the non-recurring tax benefit. References to core operating income measures mean net of tax, whether or not noted.
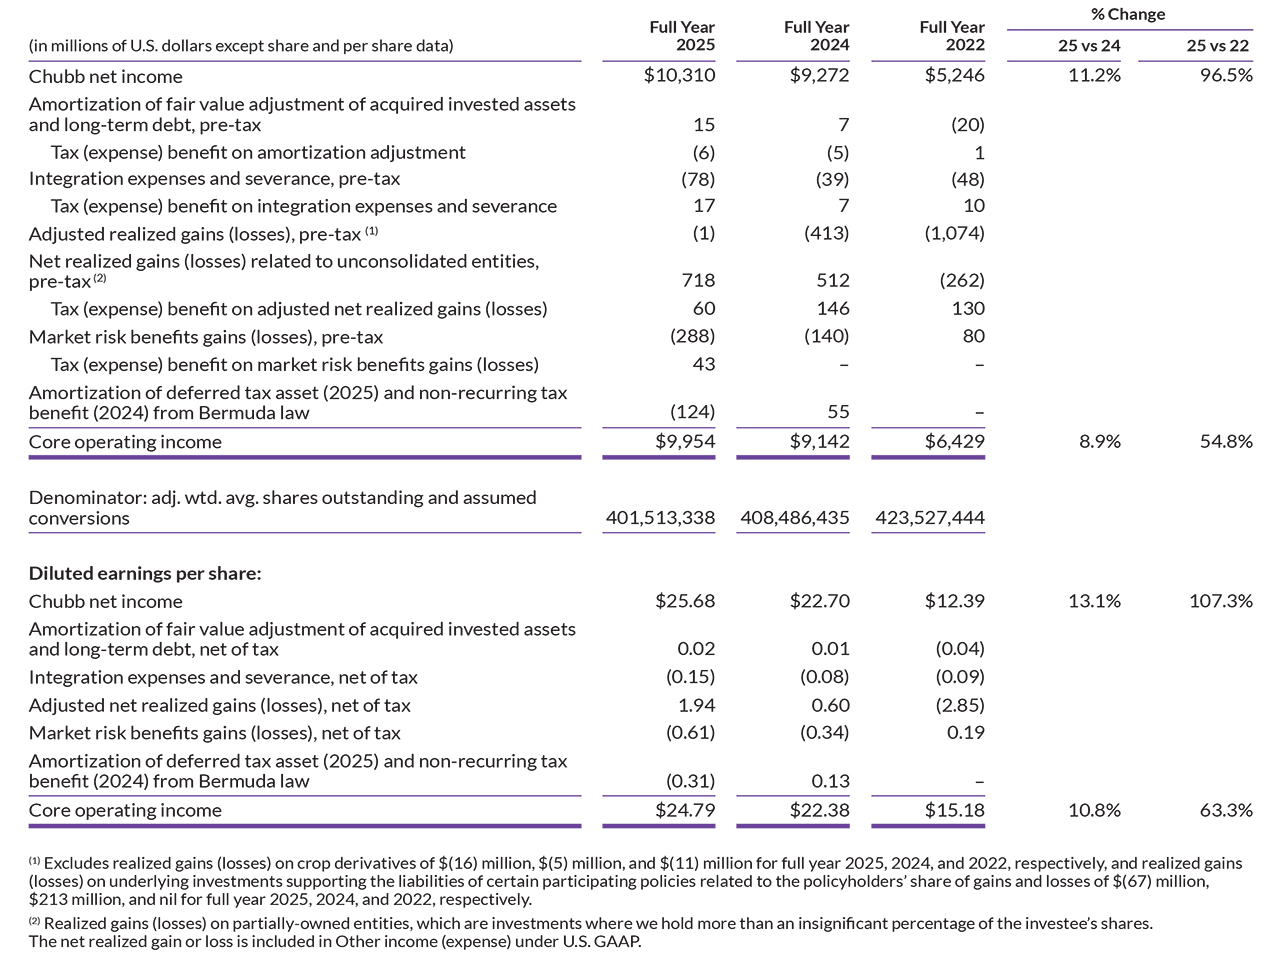
The following table presents the reconciliation of Chubb net income to Core operating income and Chubb net income per share to Core operating income per share:
Core operating return on equity (ROE) and Core operating return on tangible equity (ROTE) are annualized non-GAAP financial measures. The numerator includes core operating income (loss), net of tax. The denominator includes the average Chubb shareholders’ equity for the period adjusted to exclude unrealized gains (losses) on investments, current discount rate on future policy benefits (FPB), and instrument-specific credit risk – market risk benefits (MRB), all net of tax and attributable to Chubb. For the ROTE calculation, the denominator is also adjusted to exclude Chubb goodwill and other intangible assets, net of tax. These measures enhance the understanding of the return on shareholders’ equity by highlighting the underlying profitability relative to shareholders’ equity and tangible equity excluding the effect of these items as these are heavily influenced by changes in market conditions. We believe ROTE is meaningful because it measures the performance of our operations without the impact of goodwill and other intangible assets.
Combined ratio, a U.S. GAAP measure, and P&C combined ratio each measure the underwriting profitability of our property & casualty business. We exclude the Life Insurance segment from combined ratio and P&C combined ratio as we do not use these measures to monitor or manage that segment. The P&C combined ratio includes the impact of realized gains and losses on crop derivatives. These derivatives were purchased to provide economic benefit, in a manner similar to reinsurance protection, in the event that a significant decline in commodity pricing will impact underwriting results. We view gains and losses on these derivatives as part of the results of our underwriting operations.
Current accident year (CAY) P&C combined ratio excluding catastrophe losses excludes catastrophe losses (Cats) and prior period development (PPD) from the P&C combined ratio. We exclude Cats as they are not predictable as to timing and amount and PPD as these unexpected loss developments on historical reserves are not indicative of our current underwriting performance. The combined ratio numerator is adjusted to exclude Cats, PPD and expense adjustments on PPD, and the denominator is adjusted to exclude net premiums earned adjustments on PPD and reinstatement premiums on Cats and PPD. In periods where there are adjustments on loss sensitive policies, these adjustments are excluded from PPD and net premiums earned when calculating the ratios. We believe this measure provides a better evaluation of our underwriting performance and enhances the understanding of the trends in our P&C business that may be obscured by these items. This measure is commonly reported among our peer companies and allows for a better comparison.
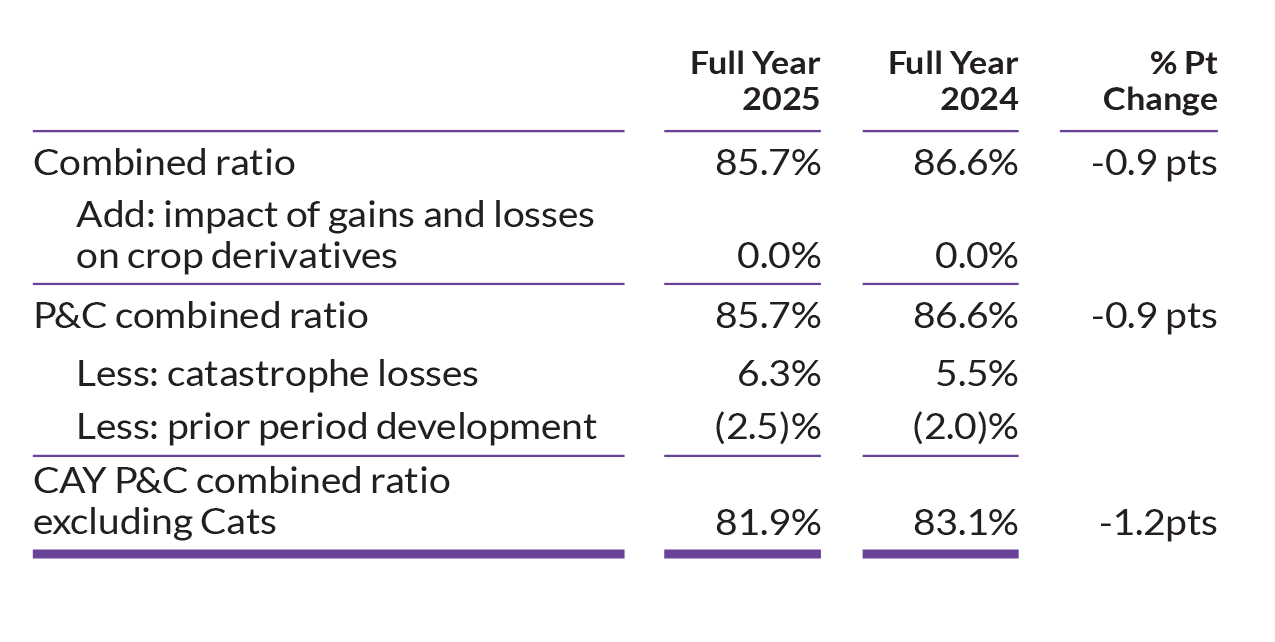
The following table presents the reconciliation of combined ratio to P&C combined ratio and CAY P&C combined ratio excluding Cats:
Book value per common share is Chubb shareholders’ equity attributable to common shareholders divided by the common shares outstanding. Tangible book value per common share is Chubb shareholders’ equity attributable to common shareholders less Chubb goodwill and other intangible assets, net of tax, divided by the common shares outstanding. We believe that goodwill and other intangible assets are not indicative of our underlying insurance results or trends and make book value comparisons to less acquisitive peer companies less meaningful.
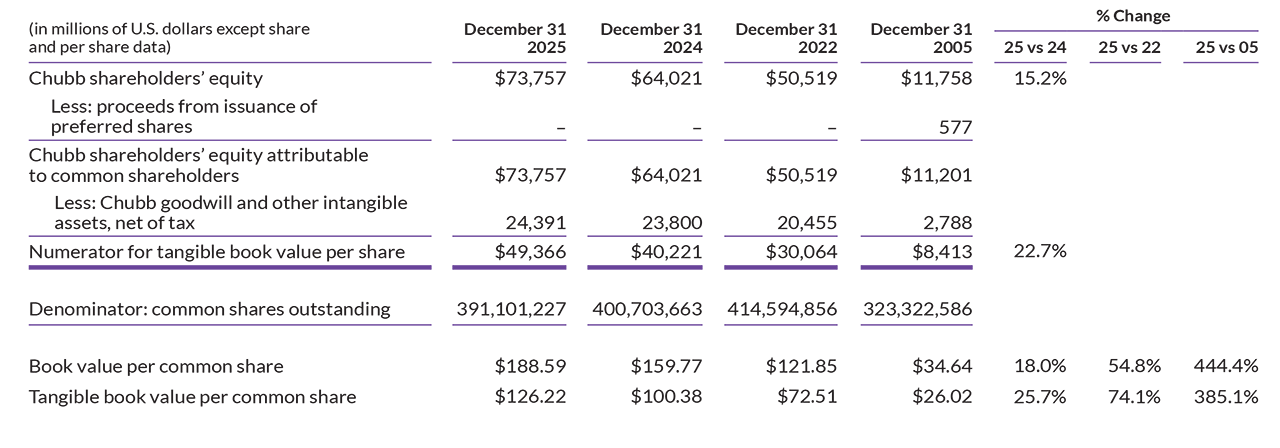
The following table presents a reconciliation of book value per common share to tangible book value per common share:
Book value per common share and tangible book value per common share excluding accumulated other comprehensive income (loss) (AOCI), excludes AOCI from the numerator because it eliminates the effect of items that can fluctuate significantly from period to period, primarily based on changes in interest rates and foreign currency movement, to highlight underlying growth in book and tangible book value.
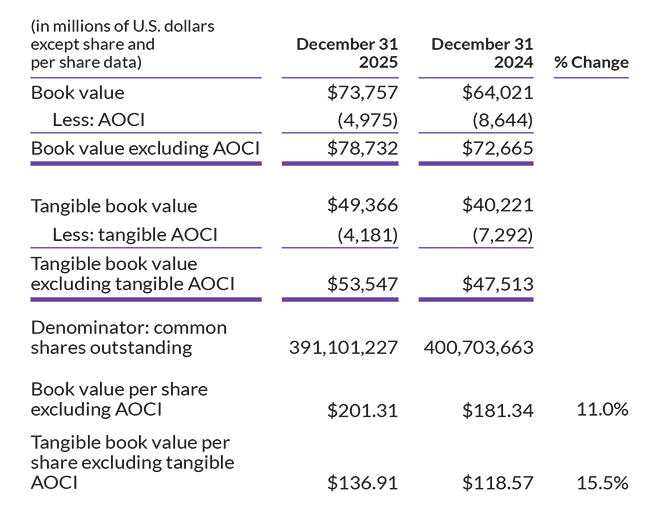
The following table presents a reconciliation of book value per common share and tangible book value per common share excluding AOCI:
International life (Chubb Life) insurance net premiums written and deposits collected and Total net premiums written and deposits collected include deposits collected on universal life and investment contracts (life deposits). Life deposits are not reflected as revenues in our consolidated statements of operations in accordance with U.S. GAAP. However, we include life deposits in presenting growth in our life insurance business because life deposits are an important component of production and key to our efforts to grow our business.
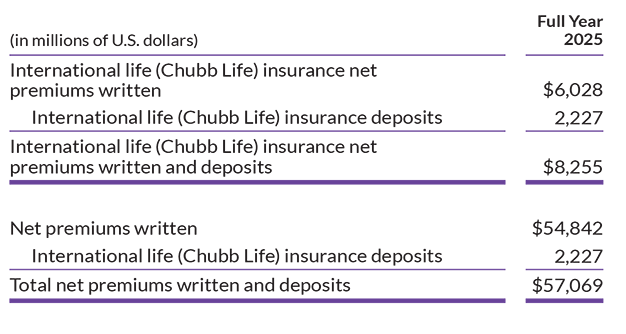
The following table presents a reconciliation of International life (Chubb Life) insurance net premiums written and deposits and of Consolidated net premiums written and deposits:
Adjusted net investment income is net investment income excluding the amortization of the fair value adjustment on acquired invested assets from certain acquisitions, and including investment income from partially-owned investment companies (private equity partnerships) where our ownership interest is in excess of 3% that are accounted for under the equity method. The mark-to-market movement on these private equity partnerships are included in adjusted net realized gains (losses) or in other income (expense) in our income statement on a U.S. GAAP basis. We believe this measure is meaningful as it highlights the underlying performance of our invested assets and portfolio management in support of our lines of business.
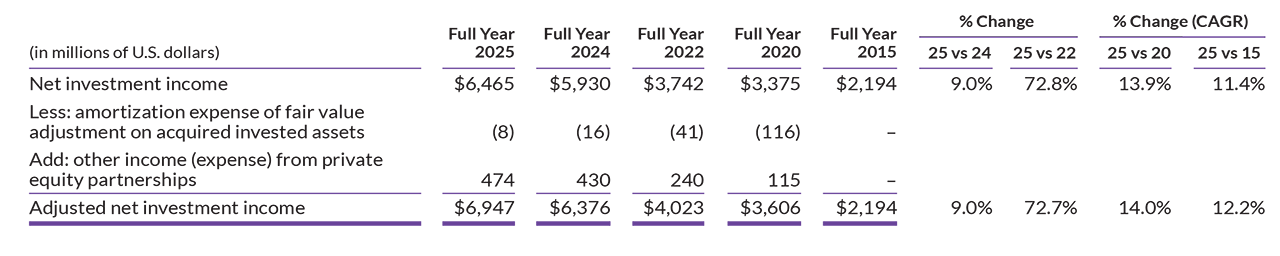
The following table presents a reconciliation of net investment income to adjusted net investment income:
P&C underwriting income excludes the Life Insurance segment and is calculated by subtracting adjusted losses and loss expenses, adjusted policy benefits, policy acquisition costs, and administrative expenses from net premiums earned. We use underwriting income (loss) and operating ratios to monitor the results of our operations without the impact of certain factors, including net investment income, other income (expense), interest expense, amortization expense of purchased intangibles, integration expenses and severance, amortization of fair value of acquired invested assets and debt, income tax expense, adjusted net realized gains (losses), and market risk benefits gains (losses).
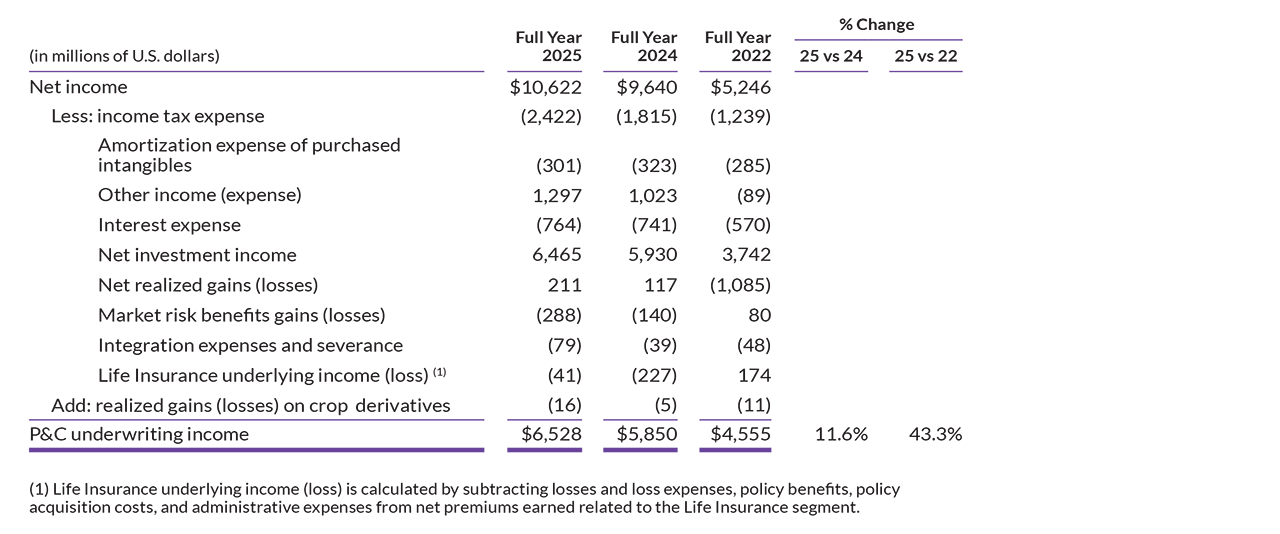
The following table presents a reconciliation of Net income to P&C underwriting income:
Cautionary Statement Regarding Forward-Looking Statements
Forward-looking statements made in this letter, such as those related to company performance, pricing, growth opportunities, economic and market conditions, product and service offerings, commitments, and our expectations and intentions and other statements that are not historical facts, reflect our current views with respect to future events and financial performance and are made pursuant to the safe harbor provisions of the Private Securities Litigation Reform Act of 1995. Such statements involve risks and uncertainties that could cause actual results to differ materially, including without limitation, the following: competition, pricing and policy term trends, the levels of new and renewal business achieved, the frequency and severity of unpredictable catastrophic events, actual loss experience, uncertainties in the reserving or settlement process, integration activities and performance of acquired companies, loss of key employees or disruptions to our operations, new theories of liability, judicial, legislative, regulatory and other governmental developments, litigation tactics and developments, investigation developments and actual settlement terms, the amount and timing of reinsurance recoverable, credit developments among reinsurers, rating agency action, possible terrorism or the outbreak and effects of war, economic, political, regulatory, insurance and reinsurance business conditions, potential strategic opportunities including acquisitions and our ability to achieve them, as well as management’s response to these factors, and other factors identified in our filings with the Securities and Exchange Commission (SEC). Readers are cautioned not to place undue reliance on these forward-looking statements, which speak only as of the dates on which they are made. We undertake no obligation to publicly update or revise any forward-looking statements, whether as a result of new information, future events or otherwise.